February 12, 2023
Chart of the Day
This Chart of the Day was inspired by the recent GlobalResearch article “How America Took Out the Nord Stream Pipeline” (see https://www.globalresearch.ca/how-america-took-out-nord-stream-pipeline/5807811) written by American investigative journalist Seymour Hersh. Here is a link to his substack article : https://seymourhersh.substack.com/p/how-america-took-out-the-nord-stream.
From the article:
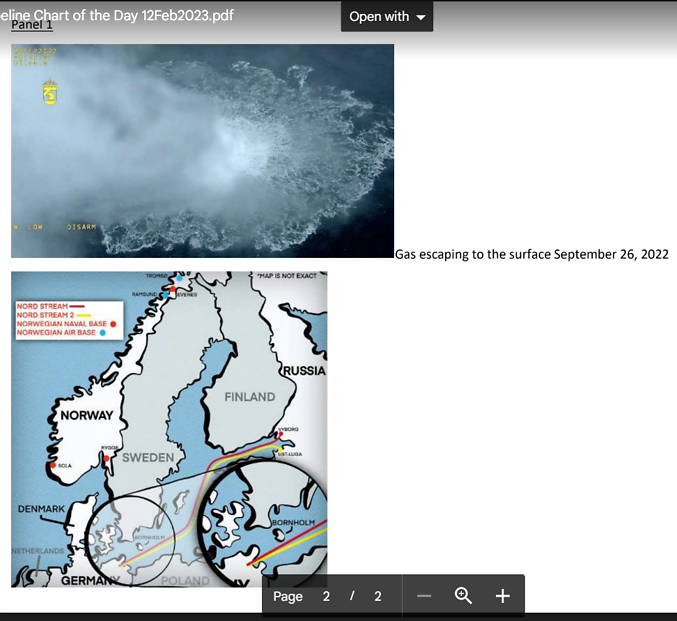
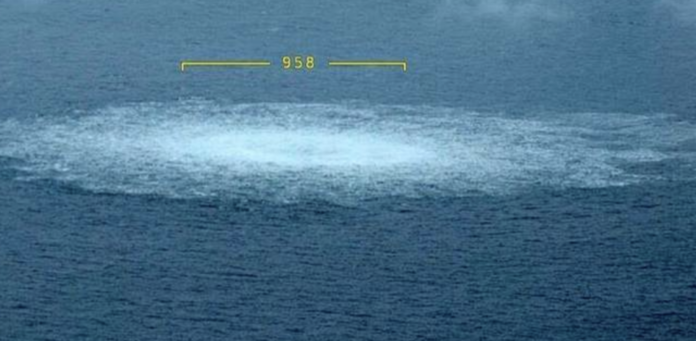
“On September 26, 2022, a Norwegian Navy P8 surveillance plane made a seemingly routine flight and dropped a sonar buoy. The signal spread underwater, initially to Nord Stream 2 and then on to Nord Stream 1. A few hours later, the high-powered C4 explosives were triggered and three of the four pipelines were put out of commission. Within a few minutes, pools of methane gas that remained in the shuttered pipelines could be seen spreading on the water’s surface and the world learned that something irreversible had taken place.”
“From its earliest days, Nord Stream 1 was seen by Washington and its anti-Russian NATO partners as a threat to western dominance.”
“Many Germans saw Nord Stream 1 as part of the deliverance of former Chancellor Willy Brandt’s famed Ostpolitik theory, which would enable postwar Germany to rehabilitate itself and other European nations destroyed in World War II by, among other initiatives, utilizing cheap Russian gas to fuel a prosperous Western European market and trading economy.”
“The USA administration’s attention once again was focused on Nord Stream. As long as Europe remained dependent on the pipelines for cheap natural gas, Washington was afraid that countries like Germany would be reluctant to supply Ukraine with the money and weapons it needed to defeat Russia.”
“Victoria Nuland expressed satisfaction at the demise of the newest of the pipelines…”the Administration is, very gratified to know that Nord Stream 2 is now…a hunk of metal at the bottom of the sea.””
Panel 1
Gas escaping to the surface September 26, 2022 including feature image.


