by Eldric Vero
September 2, 2023
This is CotD was inspired by the recent article related to the British Columbia government deficits and debts by Brian Peckford “Clean Up Your Own Act” (see https://www.eastonspectator.com/2023/08/31/clean-up-your-own-act-by-brian-peckford/). Here is a quote from the article “How about living within your means and reduce borrowing thereby reducing inflation. You are borrowing to just keep the lights on!! “
The following is a presentation of the government of British Columbia historical deficits and debts since 1997. Sources for this data include the following:
BC Public Accounts Archive : https://www2.gov.bc.ca/gov/content/governments/finances/public-accounts/archive
Canadian Taxpayers Federation Debt Clock : https://www.debtclock.ca/provincial-debtclocks/british-columbia/british-columbia-s-debt/
Tax Tips BC Provincial Debt: www.taxtips.ca/statistics/bcdebt.htm
Panel 1
This graph presents the government of British Columbia annual deficits contributing to the overall cumulative debt. Note the extreme deficit of $14.94 billion in 2021 alone which is 8 times the average annual deficits since 1997 (i.e. just under 6 standard deviations). As Brian Peckford states in his article “No doubt your Government with its’ innumerable regulations contributes to this shameful statistic.”

Panel 2
This is the graphical presentation of the government of British Columbia cumulative debt since 1997. Note the relatively stable deficits from 1997 to 2007 which includes a period of debt reduction from 2005 to 2007. Since 2007, the debt has increased by about $66 billion (tripled) to September 1, 2023 and is projected by the author to reach $105 billion by year-end 2023.

Panel 3
This is the same government of British Columbia cumulative debt as above, presented on a semi-logarithmic plot. The green line represents an average debt increase of 7.1 percent per year since 2007.

Panel 4
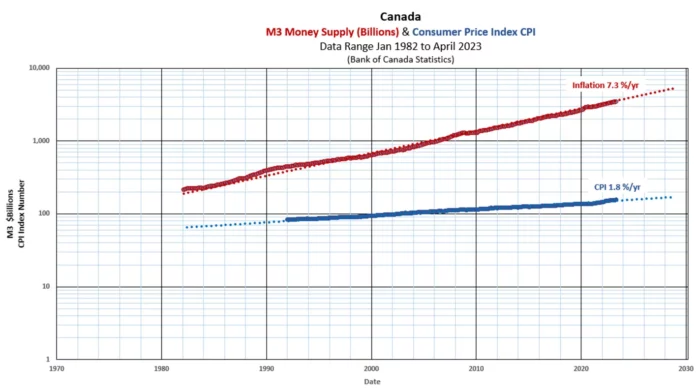
This graph was presented in the June 20, 2023 CotD. The source of inflation is from a country’s central bank, in this case, the Bank of Canada (BoC) and M3 Money Supply. The “Selected Monetary Aggregates and their Components” can be accessed via the BoC website: https://www.bankofcanada.ca/rates/banking-and-financial-statistics/selected-monetary-aggregates-and-their-components-formerly-e1/#table. Note the parallel nature of monetary Inflation via the BoC and the government of British Columbia cumulative debt above – both have averaged in the order of 7 percent per year.

“The last official act of any government is to loot the treasury” George Washington
“No one is more hated than he who speaks the truth” Plato


