


by Eldric Vero
December 1, 2023
This CotD was inspired by a recent article in GlobalResearch titled “Video: Japanese Are Protesting Sudden Deaths From COVID-19 mRNA Vaccines” (see link: https://www.globalresearch.ca/video-japanese-protesting-sudden-deaths-covid-19-mrna-vaccines/5841617). A quote from this article “Clinic Director from Ginza, Tokyo shares his observation on his vaccinated patients (Turbo Cancer)… Then, we are seeing patients with conditions like giant cell diabetes or light cell leukemia — diseases that are very rare and not often encountered in clinical practice. The cardiovascular specialist told them that they had never seen such diseases before though he read about them in books. I’m still wondering why there are so many people like this.”
The author of the CotD has combined analyses of Covid-19 and Excess Deaths (all causes) as these are related.
Panel 1 The first graph is a construct by the author as a standard CotD presentation which illustrates Covid-19 related deaths (CRDs) and vaccinations. The Japan vaccination program began in March 2021 with little effect on the death rate until about October 2021 as the death rate subsided to a very low rate indicating the vaccine program “appeared” to be effective (over 90 percent of the Japanese population was fully vaccinated by then). The death rate increased dramatically in the first quarter of 2022 from less than 5 per day to 503 per day on January 15, 2023 (over 100-fold increase) which is unimaginable to say the least. Note the booster shot to death rate correlation since April 2022 as the curves are mirror images of each other. Also as an aside, the Japan Covid-19 data on the ourworldindata.org website has not been reported since May 2023.

Panel 2 Observe the characteristic cyclical nature of deaths or all-cause mortality since 2015. The “Blue” line represents data prior to March 2020 and the “Red” line represents data since the SARS CoV-2 pandemic was initiated in March 2020. The “Green” line represents the “Expected” deaths (CotD Model) based on historical averages. The author has utilized the Japan data for the three year period January 2017 to December 2019 in order to calculate an average normalized curve for Weekly Deaths. The Expected (CotD Model) deaths incorporates an average 3.5 percent growth factor which may be somewhat conservative, however, this approach appears to be a good match to the overall trend.

Panel 3 This presents the magnified portion (January 2020 to August 2023) of the graph in Panel 2. The “Orange” line represents “Excess Deaths” which is calculated by subtracting Expected Deaths from Official Deaths.

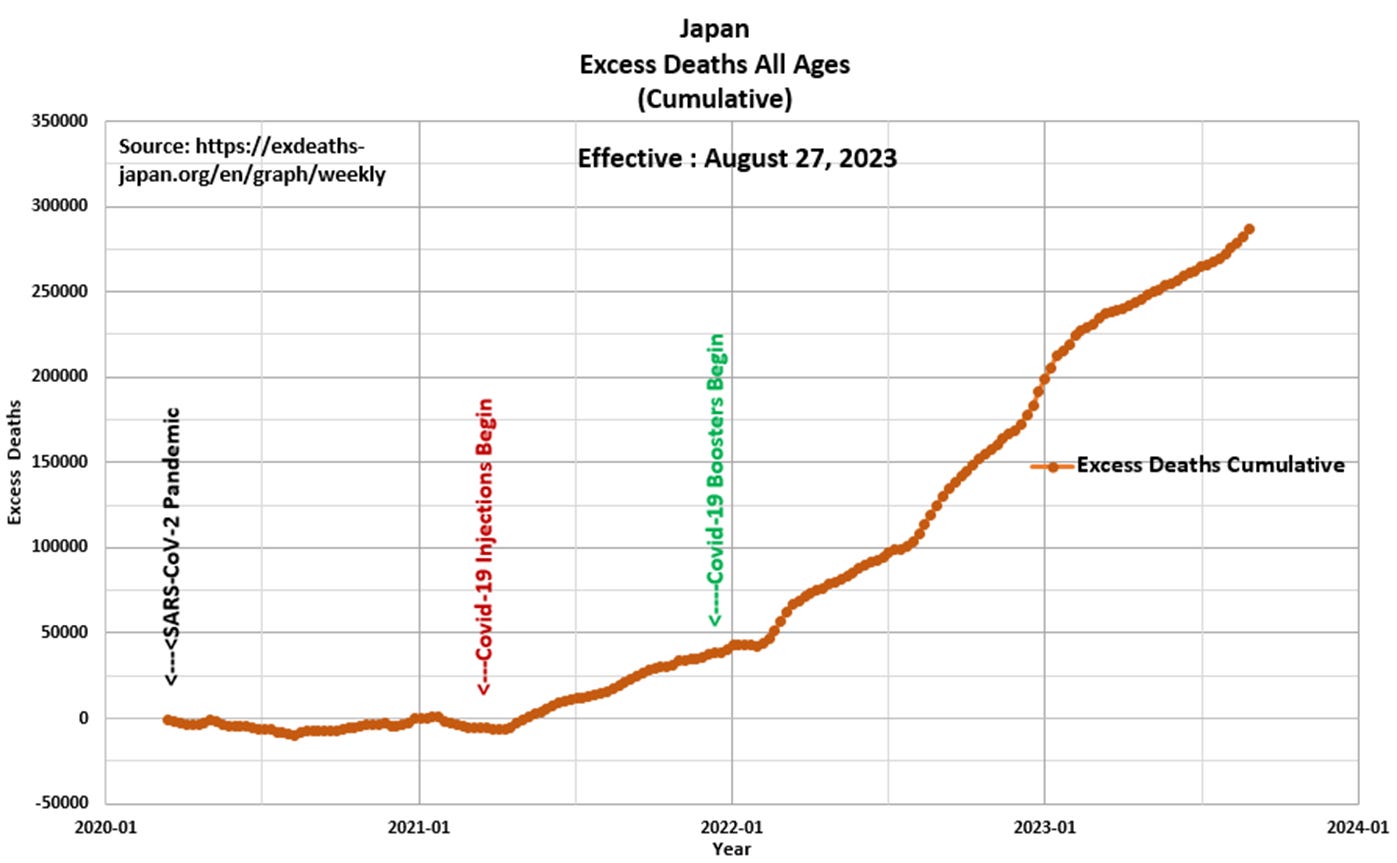
Panel 4 Based on the data and this author’s model, there have been 291,567 Excess Deaths since the start of Covid-19 injections in March 2021. This compares to 209,276 excess deaths over the same time frame as per the exdeaths-japan.org website. The bottom line is that both methods of estimating excess deaths point to a very large number (in the same ball-park) which is very concerning and requires a full investigation. The citizens of Japan know something is awry and thus need to know why this happened.

“In time, all things work to your advantage when you pursue them with an open heart” Miyamoto Musashi

Support Eldric Vero Substack
Quaecumque vera
