by Eldric Vero
December 31, 2023
This CotD was inspired by the following recent articles:
1) The Expose “Shocking Truth behind COVID Vaccines: 52.5k Brits Died Suddenly in 8 Months in 2022 due to Vaccination with Official Data proving they cause a 5-Month Countdown to Death” (see link: https://expose-news.com/2023/12/26/excessd-eaths-covid-vaccine-5-month-countdown-to-death/ ). From the article: The five-year average number of deaths in Britain over these 8 months equates to 360,531. Meanwhile, the total number of deaths in 2022 in Britain over these 8 months equates to 407,910. Therefore, Britain has suffered 47,379 excess deaths since the middle of April 2022. Could it be that the Covid-19 vaccines, which we were told would bring hope and healing, are instead causing unimaginable tragedy? An analysis of official ONS data reveals that approximately five months after each dose of the Covid-19 vaccine is administered, the mortality rates among the vaccinated rise significantly compared to the unvaccinated in each age group.
2) The Economic Times “Covid could trigger ‘heart failure pandemic’ Health experts warn of ‘global healthcare risk’ after New Year” (see link: https://economictimes.indiatimes.com/news/international/us/covid-could-trigger-heart-failure-pandemic-health-experts-warn-of-global-healthcare-risk-after-new-year/articleshow/106329039.cms?utm_source=substack&utm_medium=email ). From the article: After several countries witnessed a surge in COVID cases in recent weeks, largely due to the influx of a new strain JN.1, health experts have warned that this will increase the chances of potential heart issues for those who catch the disease. It could trigger a “heart failure pandemic” with experts sending a huge warning about a new and worrying “global healthcare risk”…The report is silent on the reasons.
3) Dr. William Makis substack “Geert Vanden Bossche PhD is panicking about JN.1 and what’s about to hit the COVID-19 Vaccinated” (see link:makismd.substack.com/p/video-geert-vanden-bossche-phd-is?utm_source=profile&utm_medium=reader2). From the video as per Dr. Bossche “the Covid-19 vaccinated must get anti-virals (Ivermectin, hydroxychloroquine, zinc, quercetin)…I would not wait”.
The author of the CotD has combined analyses of Covid-19 and Excess Deaths (all causes) as these are related. In addition, the author recommends a previous CotD “England Covid-19 Statistics” posted October 17th (https://eldric.substack.com/p/chart-of-the-day-cotd-england-covid ) for data related to vaccinated versus unvaccinated.
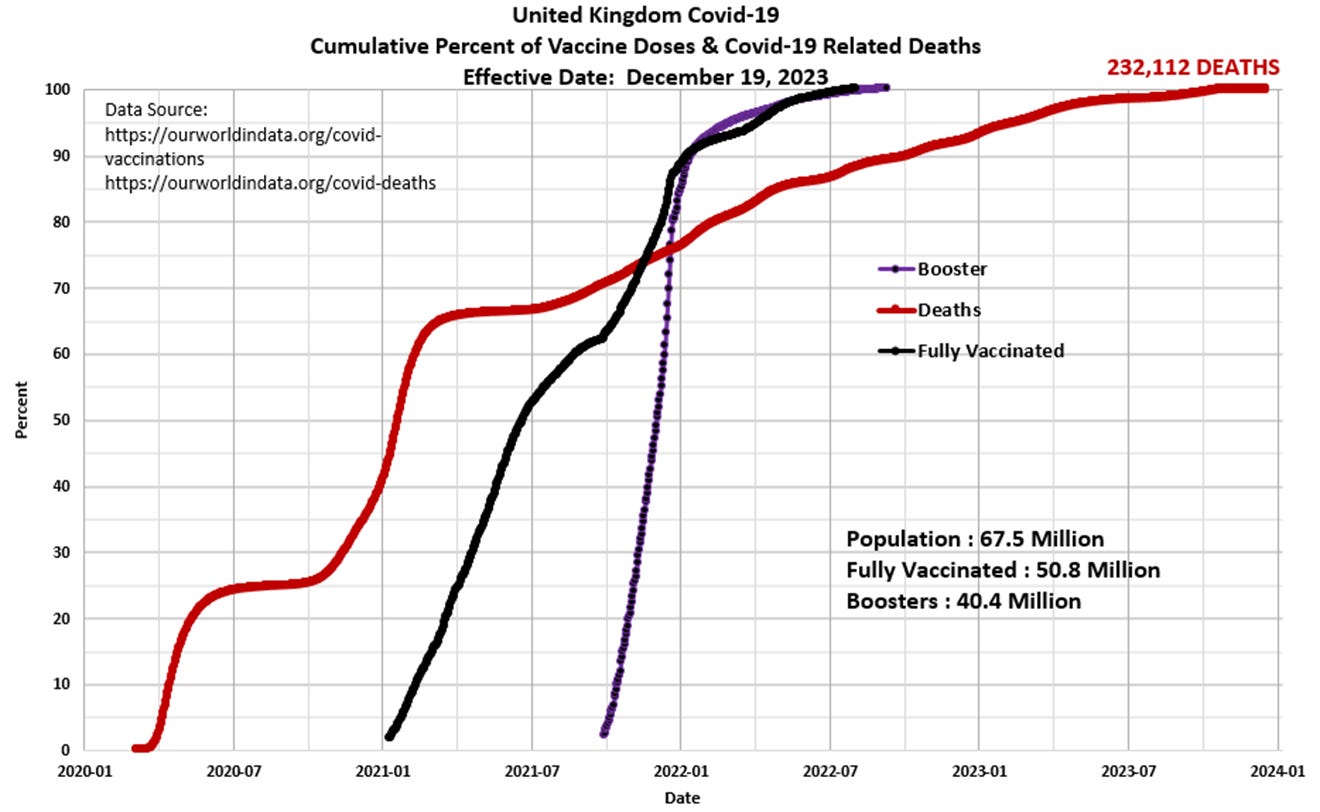
Panel 1 The first graph is a construct by the author as a standard CotD presentation which illustrates Covid-19 related deaths (CRDs) and vaccinations. The United Kingdom’s vaccination program was initiated in January 2021 with little effect on the Covid-19 Related Death (CRD) rate. The CRD rate subsided to a relatively low rate approaching the summer of 2021, indicating the vaccine program may have been effective with 50 percent of the population fully vaccinated by July 2021. The CRD rate has climbed continuously since mid-2021 in concert with the accelerated vaccine rate of uptake. There seems to be a somewhat opaque vaccine-to-deaths correlation which appears more visible in early 2022 . The vaccine data is no longer reported as of September 2022 within the ourworldindata.org website. The CRD rate has waned significantly over the past 12 months in concert with near zero vaccine uptake.
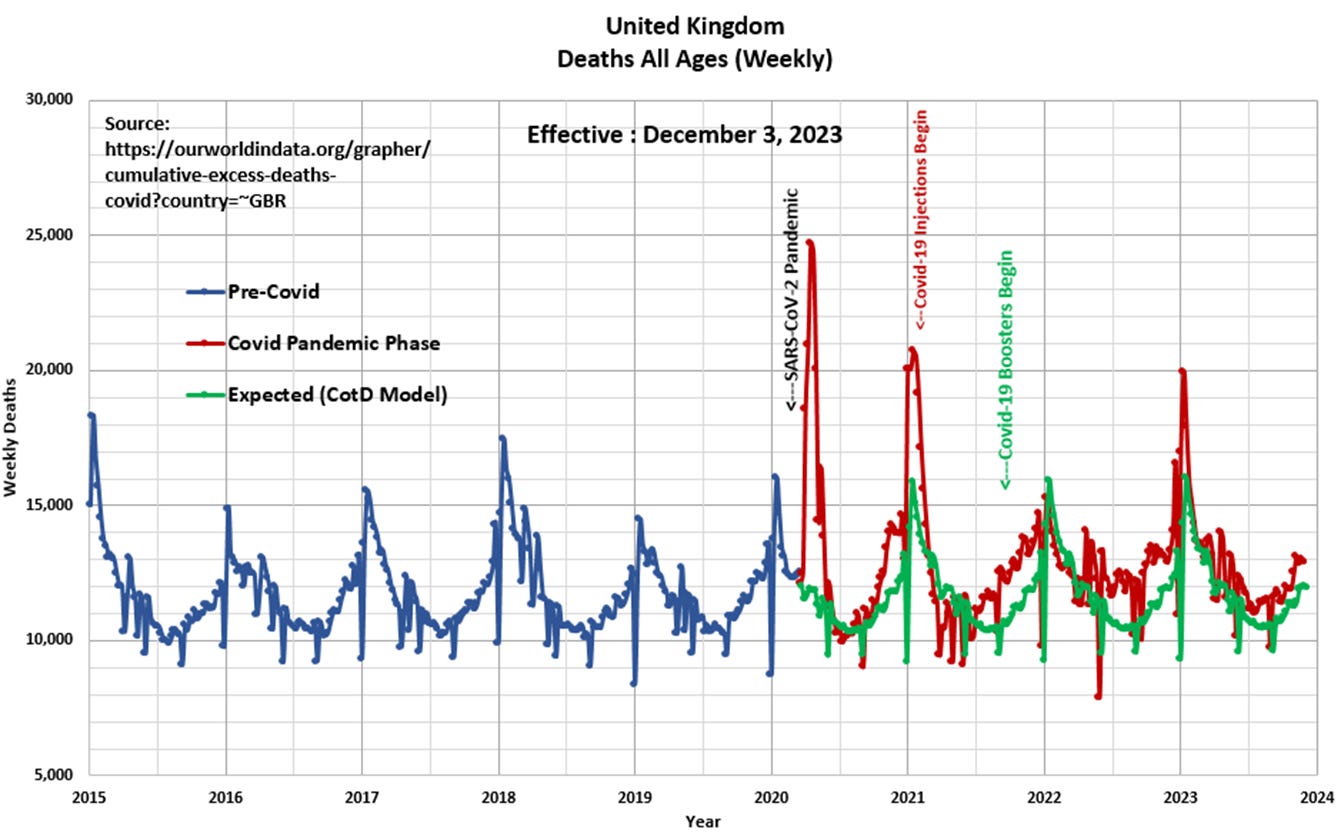
Panel 2 Observe the characteristic cyclical nature of deaths or all-cause mortality since 2015. The “Blue” line represents data prior to March 2020 and the “Red” line represents data since the SARS CoV-2 pandemic was initiated in March 2020. The “Green” line represents the “Expected” deaths (CotD Model) based on historical averages. The author has utilized the data for the five year period January 2015 to December 2019 in order to calculate an average normalized curve for Weekly Deaths. The Expected (CotD Model) deaths incorporates an average 1.0 percent growth factor which appears to be a good match to the overall trend.
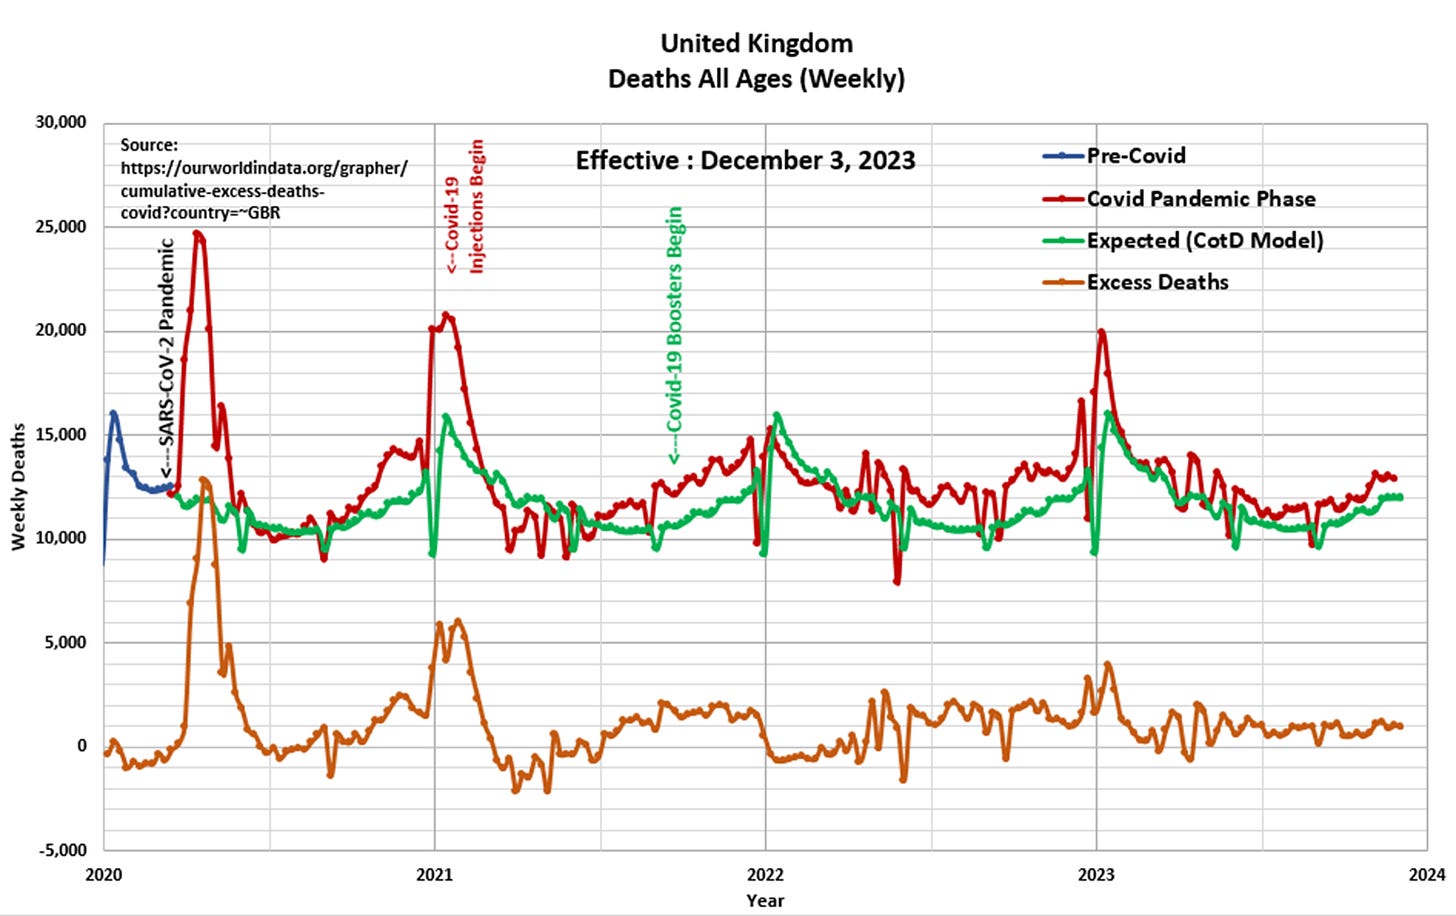
Panel 3 This presents the magnified portion (January 2020 to December 2023) of the graph in Panel 2. The “Orange” line represents “Excess Deaths” which is calculated by subtracting Expected Deaths from Official Deaths.
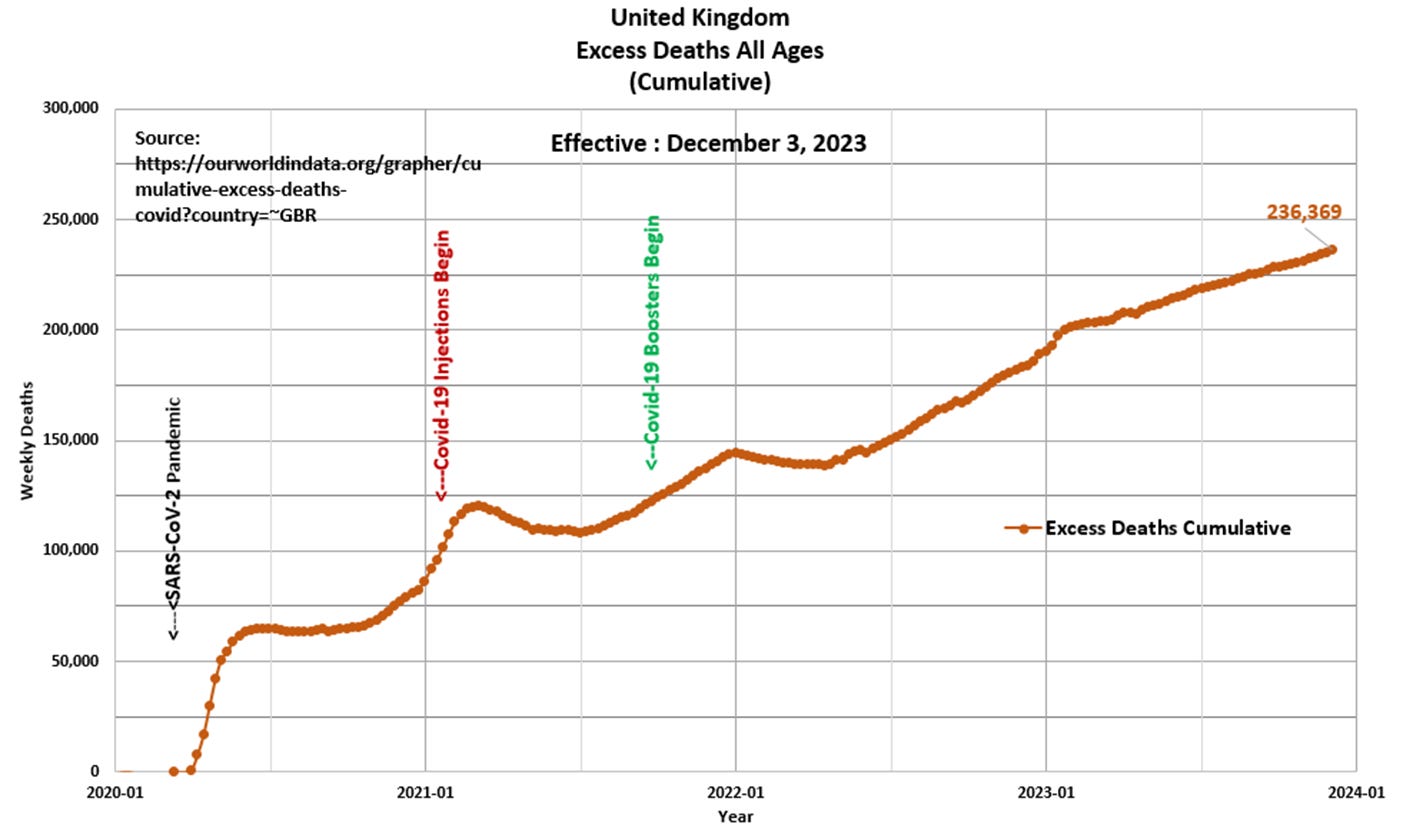
Panel 4 Based on the data and this author’s model, there have been a total of 236,369 Excess Deaths since the start of the SARS-CoV-2 pandemic of which 144,243 Excess Deaths have occurred since the start of Covid-19 injections in January 2021. This is comparable to 232,333 total Excess Deaths over the same time frame as per the https://ourworldindata.org/grapher/cumulative-excess-deaths-covid?country=~GBR website.
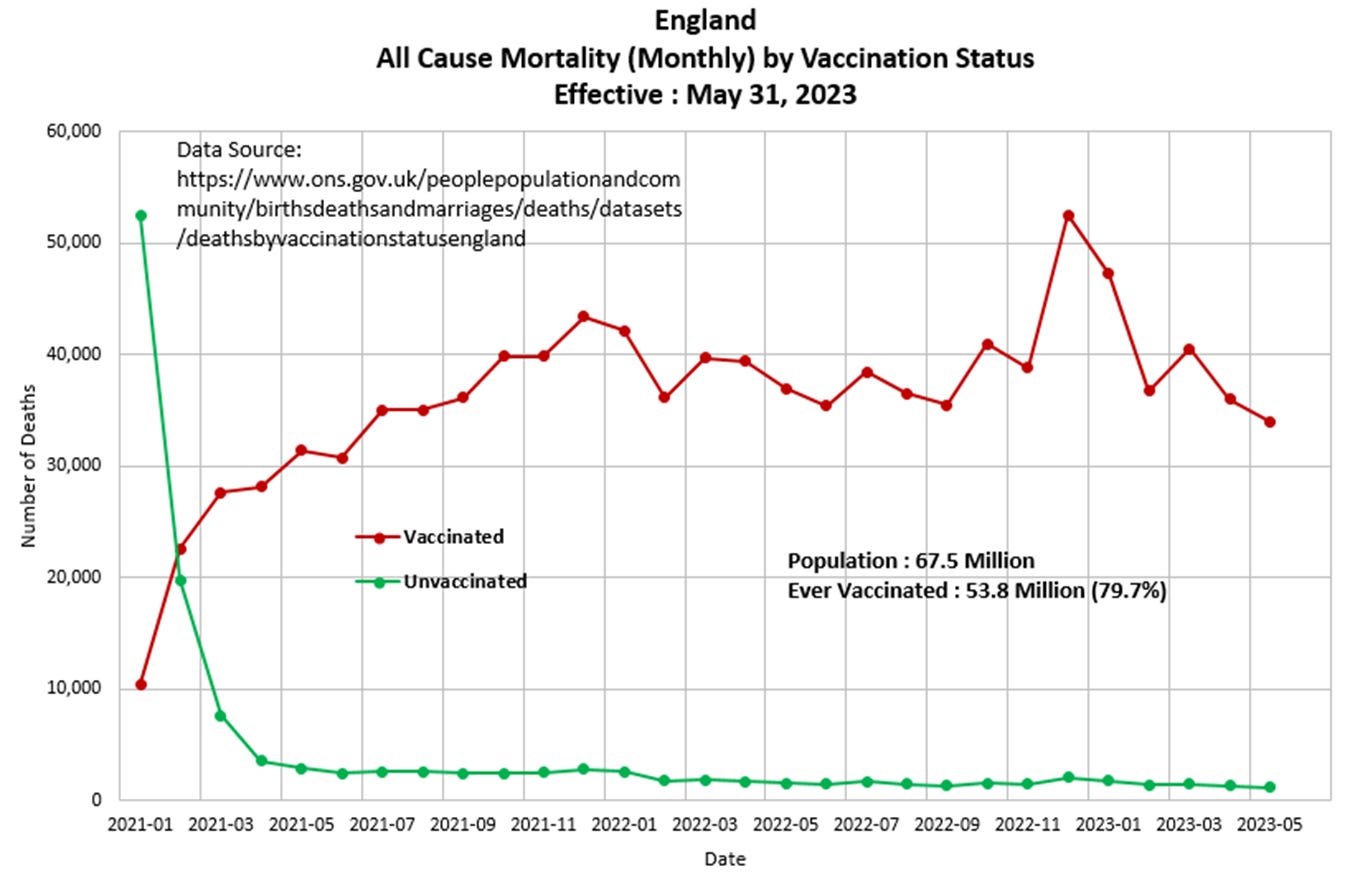
Panel 5 This presentation is based on official data from the Office for National Statistics as it pertains to Covid-19 vaccinations. The recent data in 2023 reveals 3 percent of deaths are attributed to the unvaccinated and 97 percent to the vaccinated.
“An ancestor of mine maintained that if you eliminate the impossible, whatever remains, however improbable, must be the truth.” Spock (Star Trek VI The Undiscovered Country)


