by Eldric Vero
February 17, 2-24
This CotD was inspired by two recent articles:
1) AgenciaBrazil “COVID-19: Brazil steps up vaccination, monitors new variants” (see link: https://agenciabrasil.ebc.com.br/en/saude/noticia/2023-12/covid-19-brazil-steps-vaccination-monitors-new-variants ). From the article: “Following the identification of two sub-variants of COVID-19 in Brazil (JN.1 and JG.3), the Ministry of Health announced it is monitoring the situation and has reinforced vaccination as the main means of protection against the disease. “The Ministry of Health remains aligned with all the scientific evidence, with the most up-to-date recommendations of the World Health Organization for tackling COVID-19, including planning for vaccination in 2024, which is underway.”
2) AgenciaBrazil “COVID-19 vaccine to be included in Brazilian Immunization Program” (see link: https://agenciabrasil.ebc.com.br/en/saude/noticia/2023-11/covid-19-vaccine-be-included-brazilian-immunization-program ) . From the article: As of 2024, the COVID-19 vaccine will become an integral part of the Brazilian National Immunization Program (PNI). This decision aligns with the World Health Organization’s (WHO) recommendation to administer an annual dose of the vaccine. “Our primary focus now, both globally and in Brazil, is to reduce the severity, hospitalization, and mortality related to the disease,” Maciel added.
The author of the CotD has combined analyses of Covid-19 and Excess Deaths (all causes) as these are related.
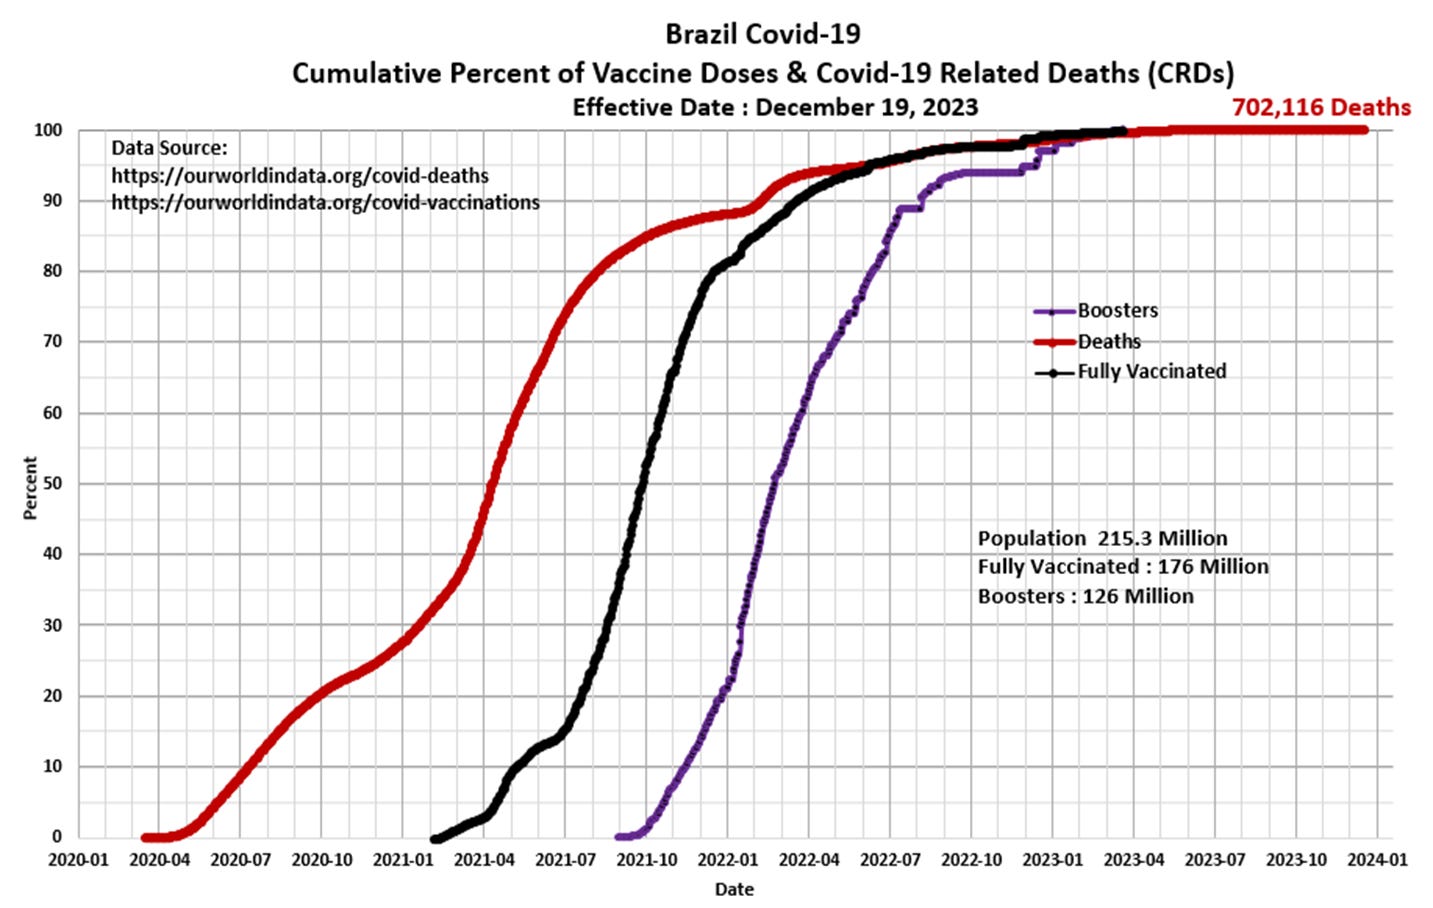
Panel 1 The first graph is a construct by the author as a standard CotD presentation which illustrates Covid-19 related deaths (CRDs) and vaccinations. Brazil’s Covid-19 Related Death (CRD) rate was at a relatively high rate from the pandemic outset of March 2020 to December 2020. The vaccination program started in February 2021 with high injection uptake rates into year-end. Observe the consistent rise of CRDs immediately after the injection program was initiated. The vaccine-to-deaths correlation is a mirror-like image which appears to be clearly evident. The CRD rate peaked at 4,249 Brazilian citizens dying in one day during April 10, 2021 (i.e. 177 deaths per hour!). Note the vaccine data set in the ourworldindata.org website terminates in March 2023. The total CRDs of 702,116 calculates to be 1 death per 307 Brazil citizens.

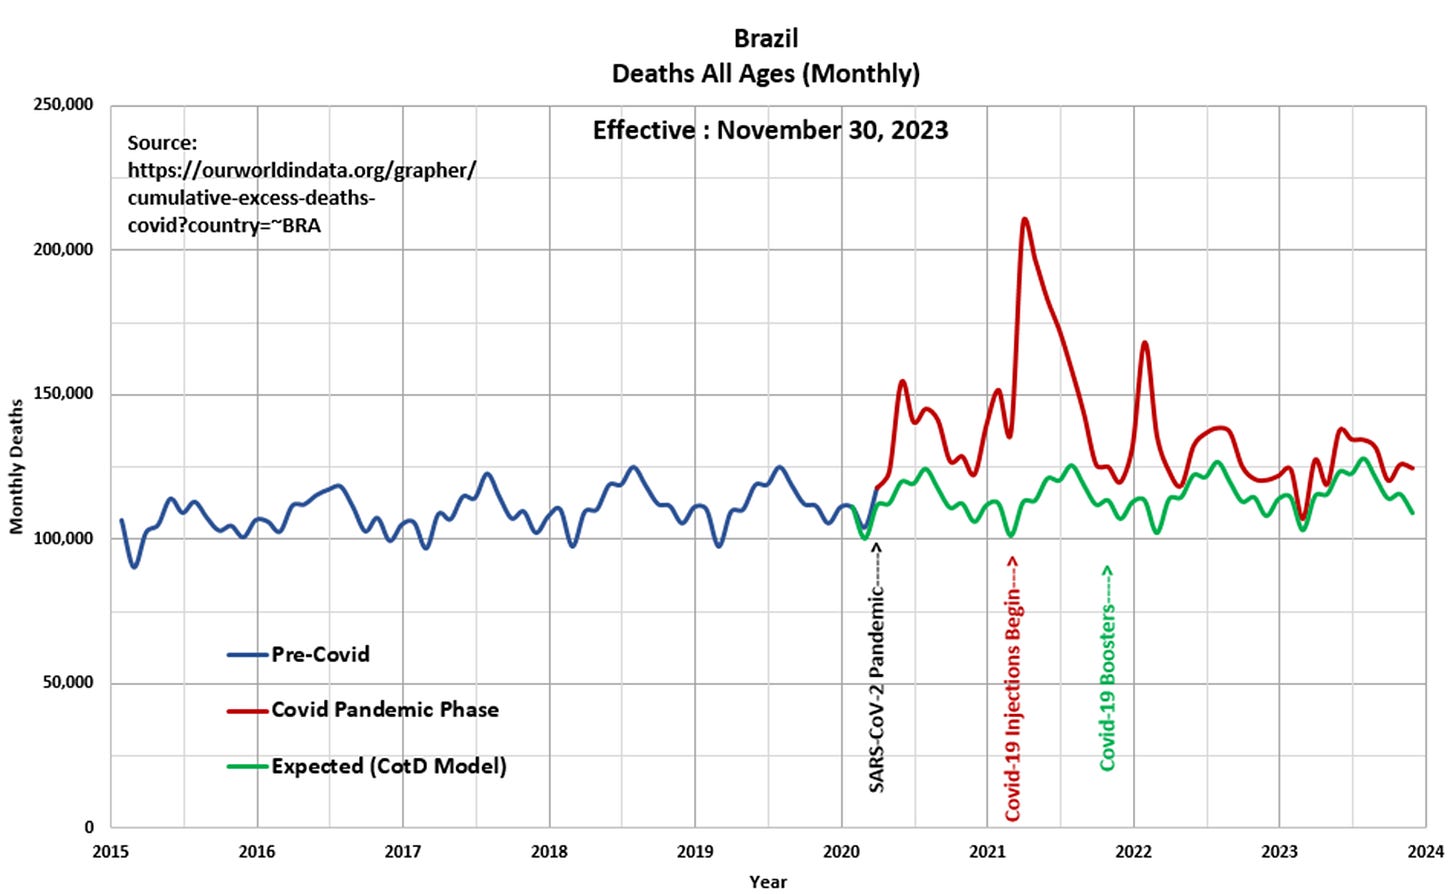
Panel 2 Observe the characteristic cyclical nature of deaths or all-cause mortality since 2015. The “Blue” line represents data prior to March 2020 and the “Red” line represents data since the SARS CoV-2 pandemic was initiated in March 2020. The “Green” line represents the “Expected” deaths (CotD Model) based on historical averages. The author has utilized the data for the five year period January 2015 to December 2019 in order to calculate an average normalized curve for Monthly Deaths. The Expected (CotD Model) deaths incorporates an average 5 percent growth factor which sounds somewhat aggressive, however, this appears to be a good match to the overall trend.

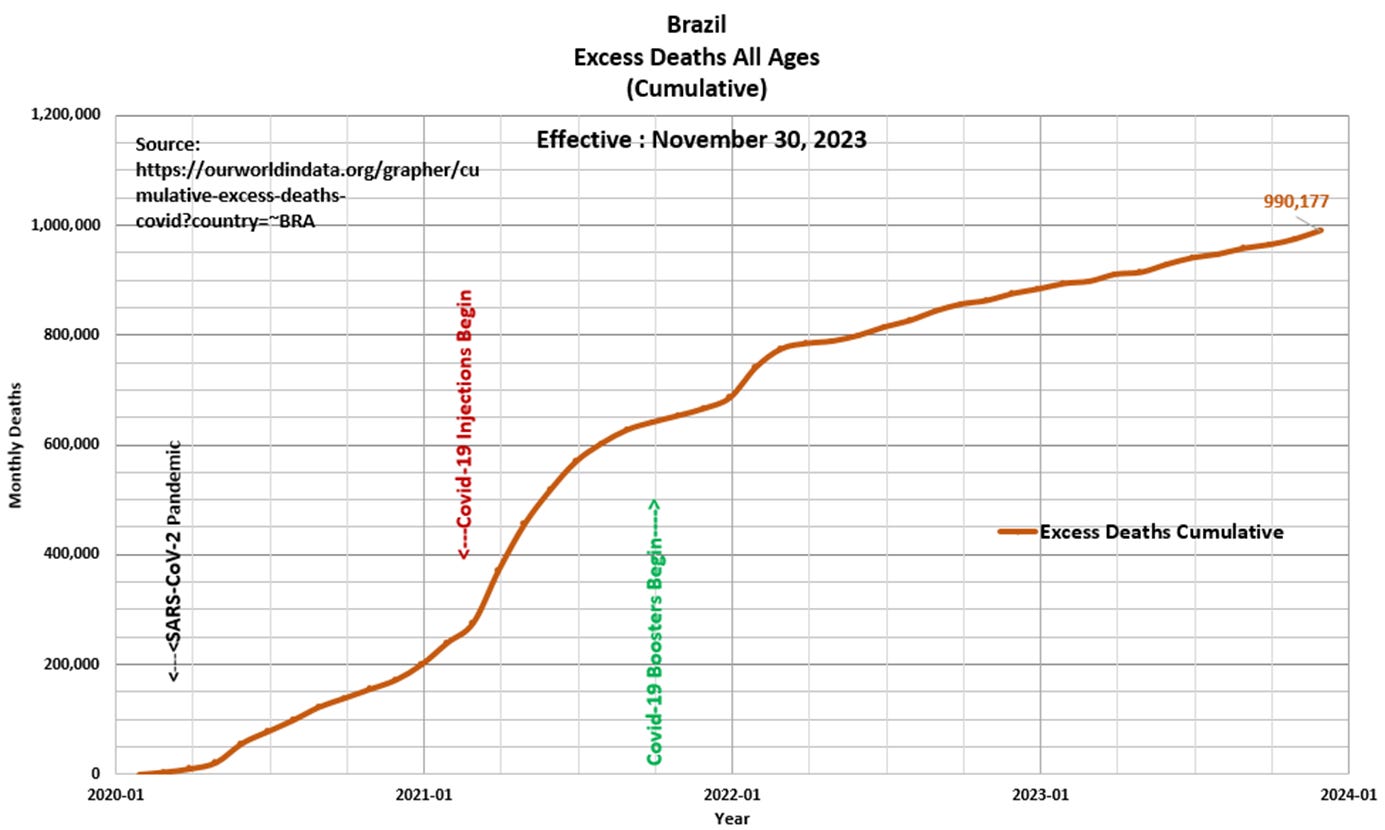
Panel 3 This presents the magnified portion (January 2020 to November 2023) of the graph in Panel 2. The “Orange” line represents “Excess Deaths” which is calculated by subtracting Expected Deaths from Official Deaths. Note that over 209,000 deaths occurred in the month of March 2021 (shortly after the Cocvid-19 injections began) which is unbelievable. This is comparable to the combined atomic bombing deaths of Hiroshima and Nagasaki in 1945.

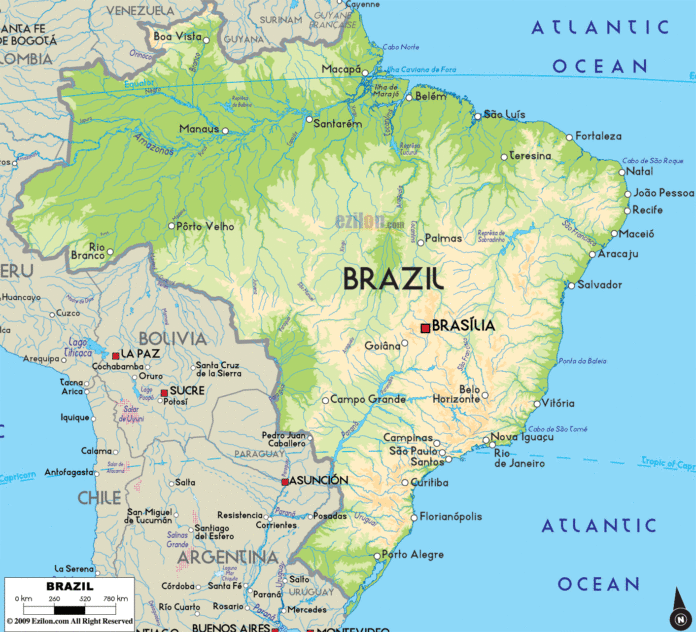
Panel 4 Based on the data and this author’s model, there have been 990,177 Excess Deaths since the start of the pandemic of which 750,000 Excess Deaths (75.7 percent) have occurred since the start of Covid-19 injections in February 2021. This compares to 935,331 Excess Deaths since February 2021 as per the https://ourworldindata.org/grapher/cumulative-excess-deaths-covid?country=~BRA website.

“Throw me to the wolves and I will return leading the pack” Unknown author
Quaecumque vera


