by Eldric Vero
March 20, 2024
This CotD was inspired by two recent articles:
1) CTV News “Maritime provinces launch spring COVID-19 vaccine campaigns” (see link: https://atlantic.ctvnews.ca/more/maritime-provinces-launch-spring-covid-19-vaccine-campaigns-1.6812000 ). From the article: “Vaccination against COVID-19 has been proven to reduce your risk of serious illness, hospitalization, and death,” said Dr. Heather Morrison, chief public health officer, in the release. “We will continue to follow NACI guidance and encourage individuals on the timing of additional booster doses if recommended. “COVID-19 is circulating in Canada and elsewhere. Getting vaccinated is an important way to help protect against the impacts of the virus,” said Dr. Yves Léger, acting chief medical officer of health (New Brunswick), in the release. “If you have not been vaccinated as part of the current vaccination campaign that began Oct. 16, we encourage you to do so.”
2) The Expose News “Covid origins and that vaccines were unsafe and ineffective were covered up to protect the integrity of the bioweapon industry, Dr. Harvey Risch says” (see link: https://expose-news.com/2024/03/14/covid-covered-up-to-protect-the-bioweapon-industry/ ). From the article: As per Dr. Harvey Risch (Professor Emeritus and Senior Research Scientist in Epidemiology at Yale University) “Without a successful vaccine to show for itself in the time of a pandemic crisis – especially one caused by a leak from a bioweapons industry source itself – it would be clear to everyone that the rationale for the industry’s existence was a fraud in the first place. And so, the covid vaccines themselves supplied the defence against the charge that the bioweapons industry was not actually dual use, but offensive only violating the 1975 Treaty. So, the vaccines had to be dramatically pushed out to be the universal solution to show that the bioweapons industry was actually working for the public good. And in this context, it did not matter what collateral damage the vaccines caused. All there had to be was the public thought of this theatre that the industry had been doing its work to produce usable vaccines, not offensive bioweapons.”
The author of the CotD has combined analyses of Covid-19 and Excess Deaths (all causes) as these are related.
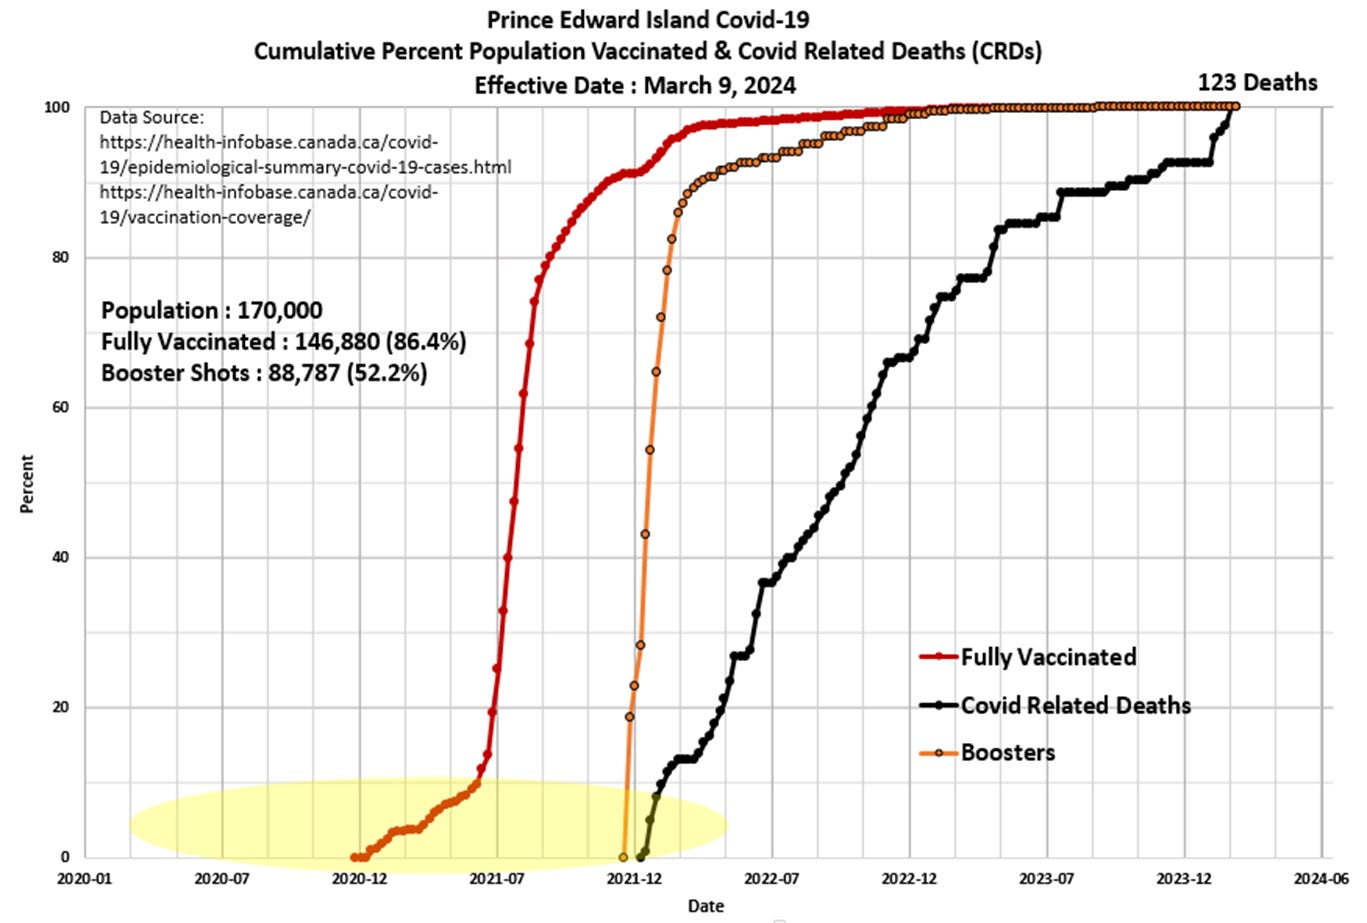
Panel 1 The first graph is a construct by the author as a standard CotD presentation which illustrates Covid-19 Related Deaths (CRDs) and vaccinations. Prince Edward Island (PEI) Covid-19 data trend is unique in Canada as there were no Covid related deaths (CRDs) until January 2022 (nearly two years after the pandemic was officially declared by the WHO). PEI is a good control group in evaluating vaccine safety and efficacy. The PEI vaccination program started in December 2020 even though there were zero CRDs. The booster program was actually initiated in Q4 2021, however, the program ramped-up significantly by March 2022. The vaccines-to-deaths correlation is stunning as 123 PEI citizens (1 per 1382 population) have died since January 2022. Based on the Health Canada vaccine status statistics, it can be reasonably presumed that at least 105 PEI citizens (85 percent) are vaccine related deaths (see the May 18, 2023 CotD related to Canada “Covid-19 Health Outcomes by Vaccination Status” https://eldric.substack.com/p/chart-of-the-day-cotd-covid-19-health ).
Remember, as per Health Canada : “Evidence indicates that vaccines and boosters are effective at helping to prevent serious illness, hospitalization and death due to COVID-19. Evidence indicates that the benefits of COVID-19 vaccines continue to outweigh the risks of the disease. Receiving an mRNA booster dose provides even better protection.” Do you think the data supports these claims by Health Canada?

Panel 2 Due to PEI’s population, the death statistics are low and present as “noisy” on the graph. A 12 month moving average has been included to “smooth-out” the data in order to view the cyclical nature of deaths or all-cause mortality since 2015. The “Blue” line represents data prior to March 2020 and the “Red” line represents data since the SARS CoV-2 pandemic was initiated in March 2020. The “Green” line represents the “Expected” deaths (CotD Model) based on historical averages. The author has utilized the data for the five year period January 2015 to December 2019 in order to calculate an average normalized curve for Monthly Deaths. The Expected Deaths (CotD Model) incorporates an average 7.0 percent growth factor which is the highest rate forecast this author has utilized of all CotD analyses to date. This appears to be a reasonable match to the overall pre-pandemic trend.

Panel 3 This presents the magnified portion (January 2020 to September 2023) of the graph in Panel 2. The “Orange” line represents “Excess Deaths” which is calculated by subtracting Expected Deaths from Official Deaths. Note the divergence in the Expected (CotD Model) deaths versus the post-injection deaths moving average curves.

Panel 4 Based on the data and this author’s model, 526 Excess Deaths have occurred since the start of the pandemic of which 500 (95 percent) have occurred since the start of Covid-19 injections in December 2020. This compares to some 200 Excess Deaths since March 2020 as per the Statistics Canada https://www150.statcan.gc.ca/t1/tbl1/en/cv.action?pid=1310078401 website . Note the black-dotted curve is a polynomial (non-linear) best-fit to the data up-trend. In essence, this reveals that the Excess Death Rate (EDR) is accelerating with time, which is a strong signal something is abnormal within PEI’s population. Once again, the question is “why is this occurring?

“The best way to overcome limiting beliefs, is to replace them with liberating truths” Michael Hyatt
Support Eldric Vero Substack
Quaecumque vera


