by Eldric Vero
May 18, 2024
This CotD was inspired by the following:
1) Bitchute “Slovakian President Rejects WHO Pandemic Treaty” (see link: https://www.bitchute.com/video/5U6RUdWdUSCB/ ). From the speech: “I also declare very clearly, the SMER Slovenska Socialna Demokratia (political party) will not support strengthening the powers of the World Health Organization at the expense of sovereign states in managing the fight against pandemics. I will say, such nonsense could only be invented by greedy pharmaceutical companies which began to perceive the opposition of some governments against mandatory vaccination.”
2) Dr. Meryl Nass COVID Newsletter “Slovakian Prime Minister Fico shot multiple times several days after announcing his nation will not be signing the WHO treaty and amendments” (see link: https://merylnass.substack.com/p/slovakian-prime-minister-fico-shot ). As per the article: “PM Robert Fico lived through his surgery and is expected to survive. 5 bullets were fired at close range and as best I can tell his abdomen and a joint were hit. None of the articles I have read about this mentions the WHO at all, even though he is the first head of state in 2024 to openly reject the WHO’s 2 treaties. Hoping he is able to heal well and quickly. Unless we want to abet future assassinations of those who stand against the globalist forces, this attempted assassination must be the catalyst to stop the current WHO negotiations and delay or end any consideration of both treaties.”
The author of the CotD has combined analyses of Covid-19 and Excess Deaths (all causes) as these are related.
Panel 1 The first graph is a construct by the author as a standard CotD presentation which illustrates Covid-19 related deaths (CRDs) and vaccinations. The Slovakia vaccination program began in January 2021 with little effect on the increasing death rate until about the summer of 2021 as the death rate subsided to a very low rate indicating the vaccine program “appeared” to be effective (over 40 percent of the population was fully vaccinated by then). The death rate increased dramatically in Q4’2021 as the booster program was initiated. The CDR rate has subsided dramatically since the vaccine program has waned since 2022.

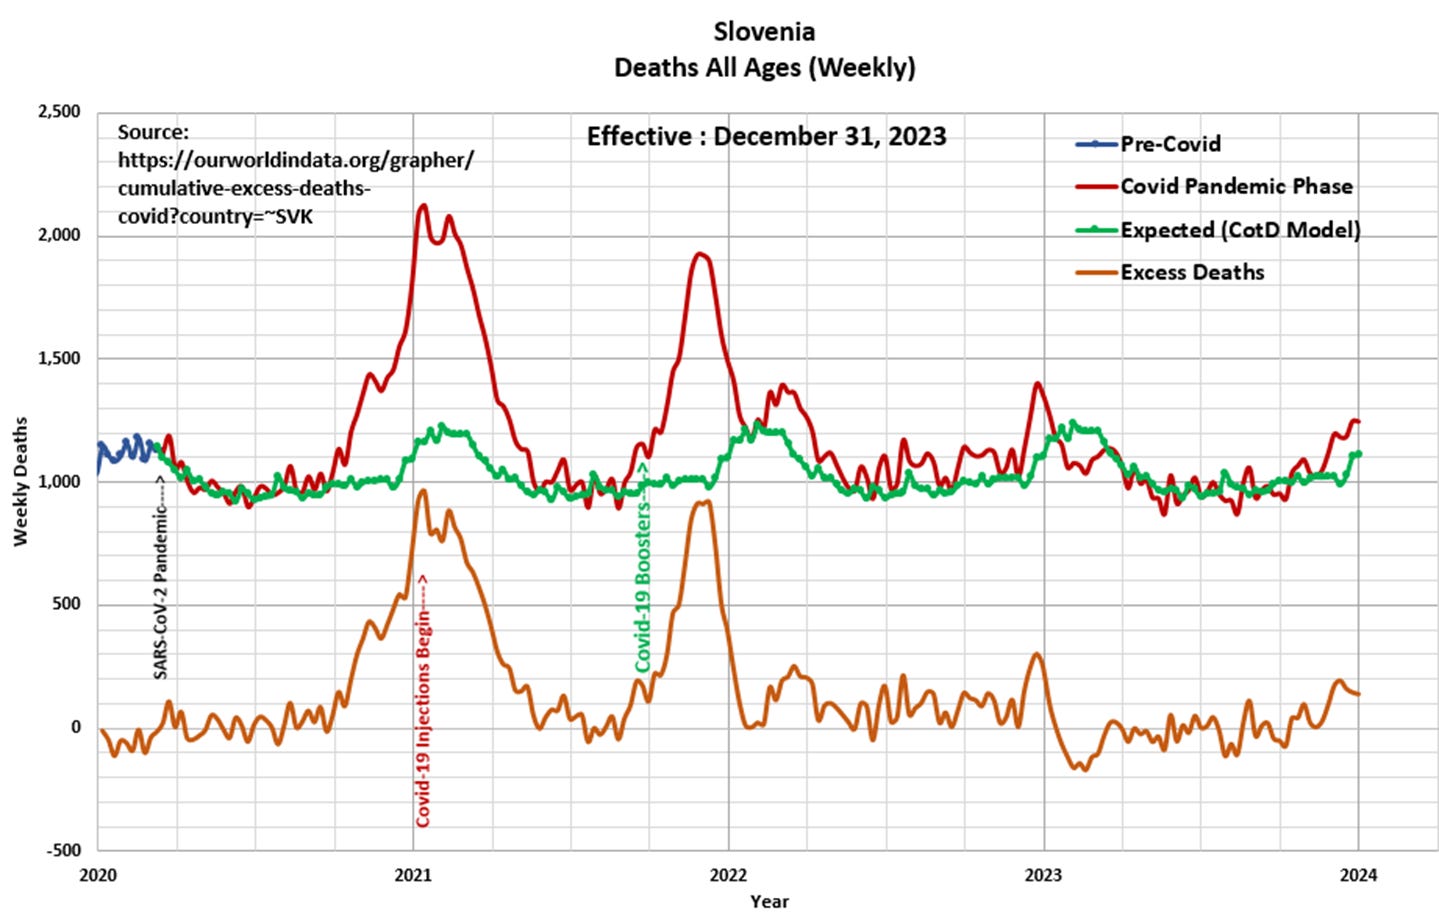
Panel 2 Observe the characteristic cyclical nature of deaths or all-cause mortality since 2015. The “Blue” line represents data prior to March 2020 and the “Red” line represents data since the SARS CoV-2 pandemic was initiated in March 2020. The “Green” line represents the “Expected” deaths (CotD Model) based on historical averages. The author has utilized the Slovenia data for the five year period January 2015 to December 2019 in order to calculate an average normalized curve for Weekly Deaths. The Expected (CotD Model) deaths incorporates an average 1 percent growth factor which appears to be a good match to the overall trend.

Panel 3 This presents the magnified portion (January 2020 to January 2024) of the graph in Panel 2. The “Orange” line represents “Excess Deaths” which is calculated by subtracting Expected Deaths from Official Deaths.

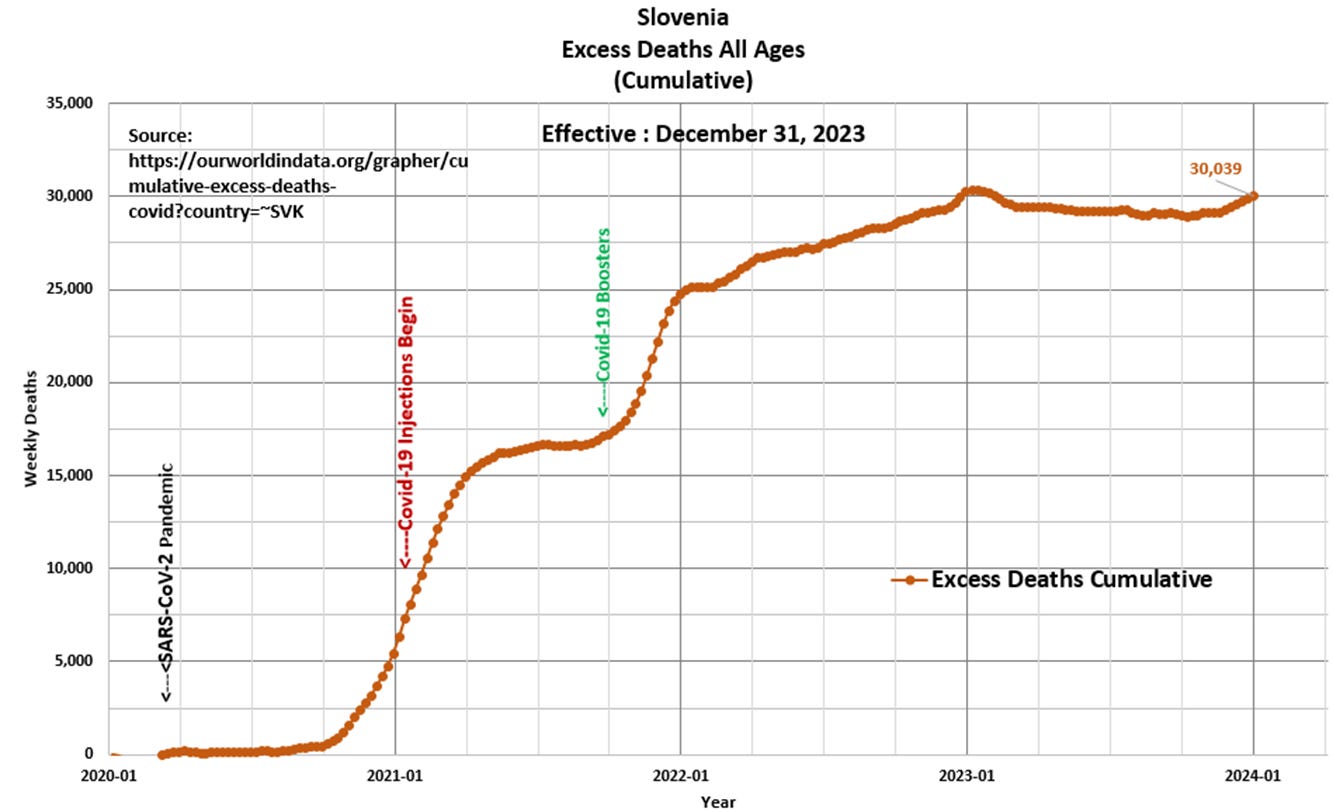
Panel 4 Based on the data and this author’s model, 30,039 Excess Deaths have occurred since the start of the pandemic, of which 22,740 Excess Deaths (76 percent) have occurred since the start of Covid-19 injections in January 2021. This compares to 30,502 Excess Deaths since the start of the pandemic as per the ourworldindata.org website.

“I am not a wounded women of my past!..I am a warrior women of God moving forward in my destiny…Hallelujah!” Unknown author


