by Eldric Vero
June 10, 2024
This CotD was inspired by the following:
1) Politico “Italy used 2 Million Covid jabs this winter. It’s locked into buying 40 Million more” (see link: https://www.politico.eu/article/documents-reveal-scale-covid-jabs-excess-italy-from-vast-eu-contracts/ ) . As per the article: Francesca Donato, a non-attached Italian MEP, called the obligation to buy the 40 million doses “scandalous,” particularly given the country’s fiscal situation. “The Italian government should refuse to accept these stifling contracts, only useful to guarantee profits for pharmaceutical corporations,” added the EU lawmaker. Many other European countries are likely in a similar situation, although that data hasn’t yet been published. Figures from the European Centre for Disease Prevention and Control (ECDC) show on average just 2.4 percent of people in the EU/EEA have received the latest Covid dose.
2) Reuters “Italy launches COVID inquiry over opposition protest” (see link: https://www.reuters.com/world/europe/italy-launches-covid-inquiry-over-opposition-protest-2024-02-14/ ) . As per the article: Italy’s parliament approved on Wednesday the creation of an official inquiry into the handling of the COVID-19 pandemic, angering opposition parties who were in power at the time and fear it will become a political witch hunt. The rightist groups were fierce critics of lockdowns and restrictions introduced by the centre-left administration of then Prime Minister Giuseppe Conte to stem infections as Italy became the first Western nation to face the health emergency in 2020. Its tasks will include assessing the readiness and effectiveness of measures put in place before the virus struck, also with an eye to dealing with any future pandemic.
The author of the CotD has combined analyses of Covid-19 and Excess Deaths (all causes) as these are related.
Panel 1 The first graph is a construct by the author as a standard CotD presentation which illustrates Covid-19 related deaths (CRDs) and vaccinations. The vaccination program began in January 2021 with little effect on the increasing death rate until about the summer of 2021 as the death rate subsided to a relatively low rate indicating the vaccine program “appeared” to be effective (over 60 percent of the population was fully vaccinated by then). The death rate increased again in Q4’2021 as the booster program was initiated. The booster-to-deaths correlation during 2022 is self-evident as both curves mirror each other. The CDR rate has subsided significantly as the vaccine program waned since early 2023.

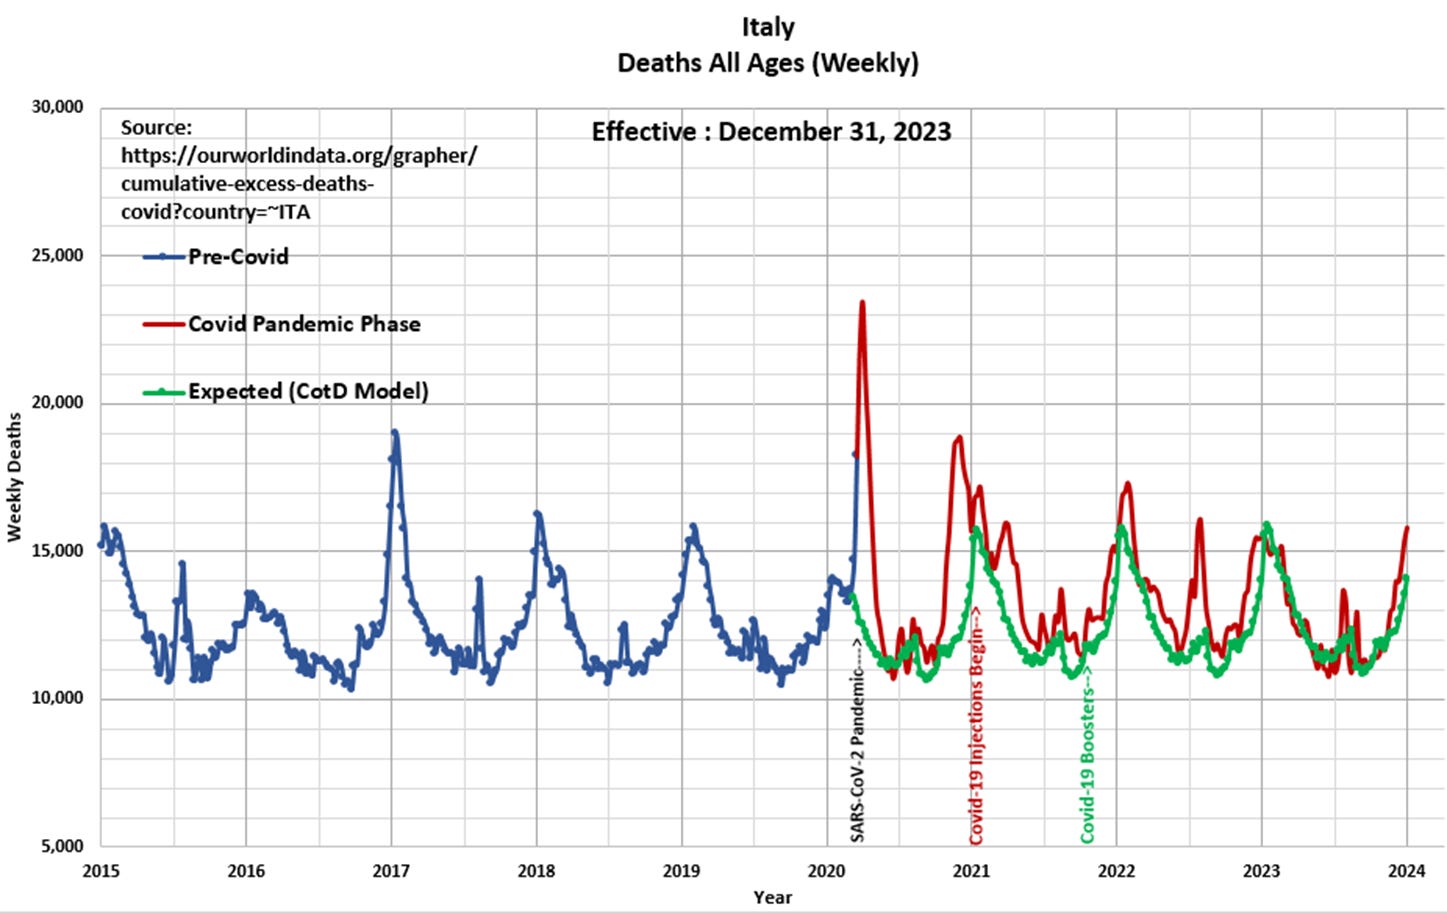
Panel 2 Observe the characteristic cyclical nature of deaths or all-cause mortality since 2015. The “Blue” line represents data prior to March 2020 and the “Red” line represents data since the SARS CoV-2 pandemic was initiated in March 2020. The “Green” line represents the “Expected” deaths (CotD Model) based on historical averages. The author has utilized the Slovenia data for the five year period January 2015 to December 2019 in order to calculate an average normalized curve for Weekly Deaths. The Expected (CotD Model) deaths incorporates an average 1 percent growth factor which appears to be a good match to the overall trend.

Panel 3 This presents the magnified portion (January 2020 to January 2024) of the graph in Panel 2. The “Orange” line represents “Excess Deaths” which is calculated by subtracting Expected Deaths from Official Deaths.

Panel 4 Based on the data and this author’s model 246,337 Excess Deaths have occurred since the start of the pandemic, of which 134,530 Excess Deaths (55 percent) have occurred since the start of Covid-19 injections in January 2021. This compares to 260,326 Excess Deaths since the start of the pandemic as per the ourworldindata.org website.

“Study the Art of Science…study the Science of Art. Develop your senses, especially learn how to see, realize that everything connects to everything else.” Leonardo da Vinci


