by Eldric Vero
June 30, 2024
This CotD was inspired by the following:
1) WHO News January 16, 2024 “Statement – COVID-19 vaccines saved at least 1.4 million lives in the European region” (see link: https://www.who.int/azerbaijan/news/item/16-01-2024-statement—covid-19-vaccines-saved-at-least-1.4-million-lives-in-the-european-region ). As per the article: A new study led by WHO/Europe has found that at least 1.4 million lives in our region were saved thanks to safe and effective COVID-19 vaccines. Without them, the European Region’s cumulative known death toll could have been around 4 million, possibly even higher. In fact, the first booster doses alone saved an estimated 700 000 lives. This is the power of vaccines. The evidence is irrefutable.
2) Huffpost News June 25, 2024 “COVID Is Surging Right Now. Here’s What Alarms Doctors The Most” (see link: https://www.huffpost.com/entry/covid-summer-2024-surge-symptoms_l_6679820de4b0d2f6354efe63 ). As per the article: We don’t typically associate hot weather with viral illnesses, but COVID has thwarted that in recent years. The current wave is “probably predominately [caused] by those changes in the virus that are probably resulting in it being able to better get around pre-existing immunity,” according to Aubree Gordon, a professor of epidemiology and director of the Michigan Center for Infectious Disease Threats & Pandemic Preparedness in the School of Public Health at the University of Michigan. These new variants might be adept at skirting our immunity, but getting another booster shot and wearing a high-quality mask in crowded spaces are still the very best ways to stay healthy this summer.
The author of the CotD has combined analyses of Covid-19 and Excess Deaths (all causes) as these are related.
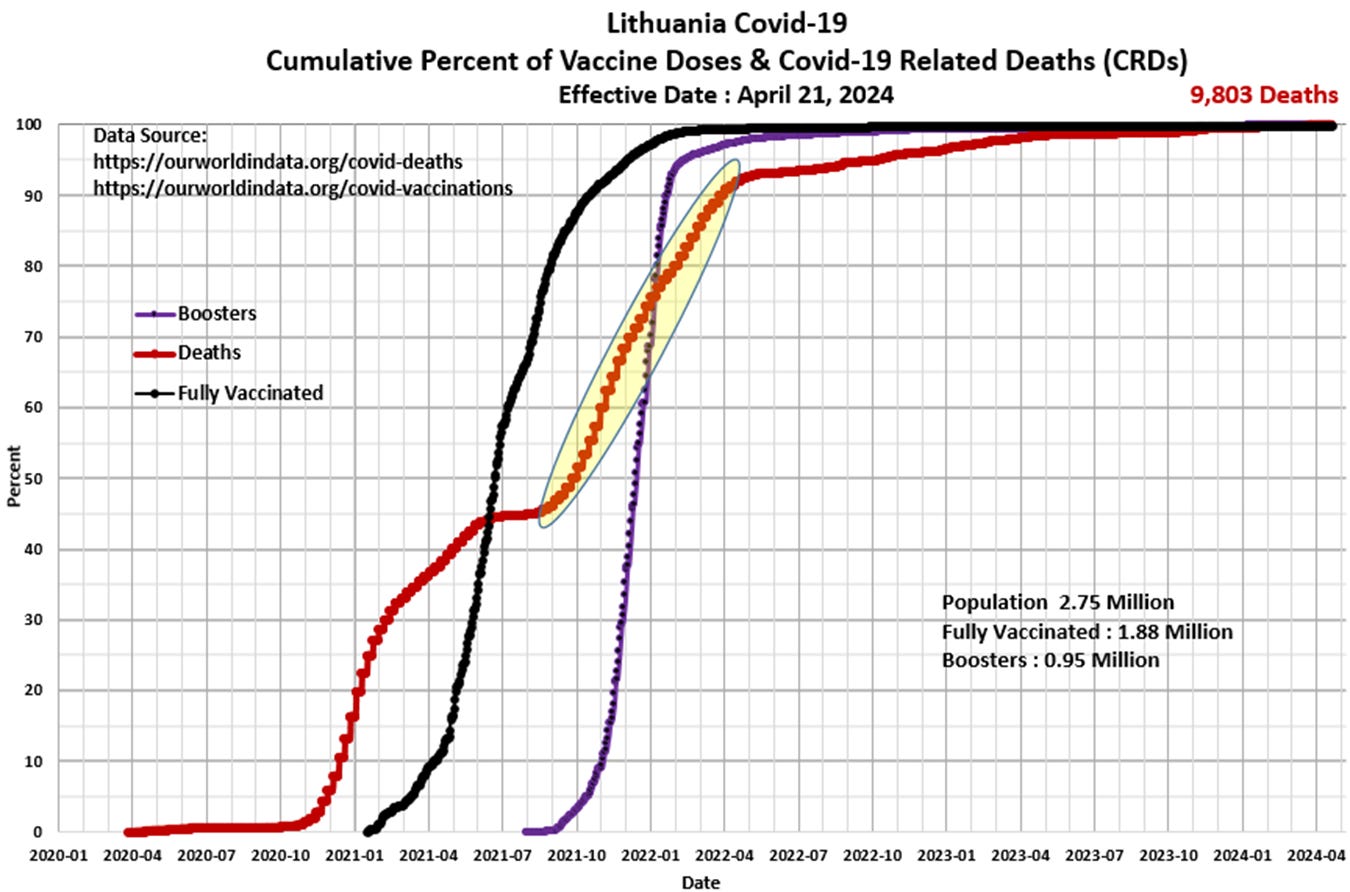
Panel 1 The first graph is a construct by the author as a standard CotD presentation which illustrates Covid-19 related deaths (CRDs) and vaccinations. The vaccination program began in January 2021 with little effect on the increasing death rate until about mid-2021 as the death rate subsided somewhat to a relatively low rate indicating the vaccine program “appeared” to be effective (over 60 percent of the population was fully vaccinated by then). The death rate increased again in Q4’2021 as the booster program was initiated. The booster-to-death correlation is in plain view as highlighted in yellow. The CRD rate has subsided significantly since 2022 as vaccination/booster uptake rates have declined to near zero percent.
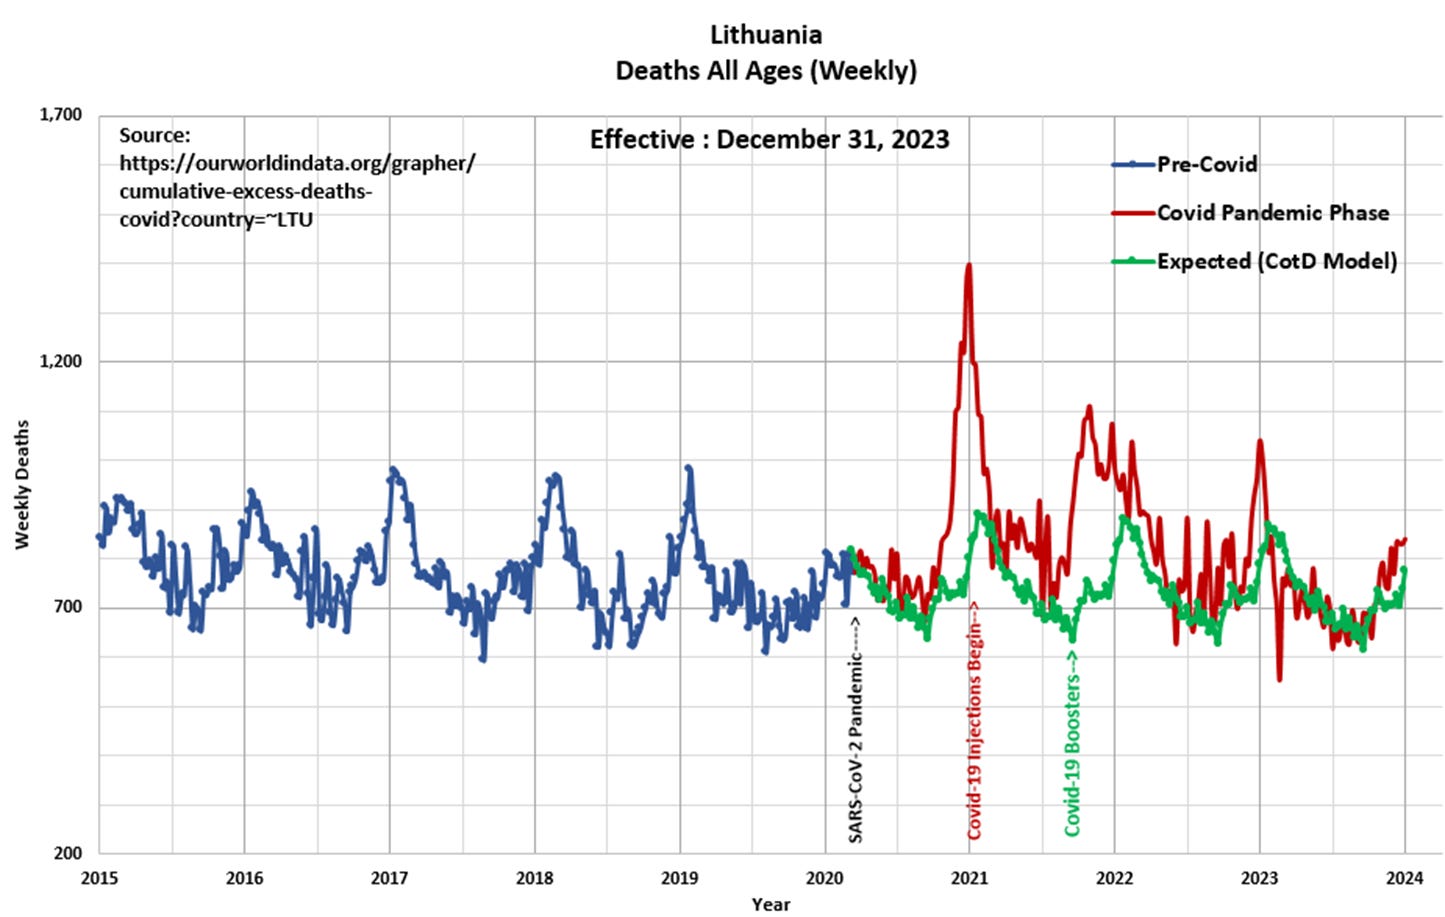
Panel 2 Observe the characteristic cyclical nature of deaths or all-cause mortality since 2015. The “Blue” line represents data prior to March 2020 and the “Red” line represents data since the SARS CoV-2 pandemic was initiated in March 2020. The “Green” line represents the “Expected” deaths (CotD Model) based on historical averages. The author has utilized the five year period January 2015 to December 2019 in order to calculate an average normalized curve for Weekly Deaths. The Expected (CotD Model) deaths incorporates an average -4.2 percent growth factor (yes a negative growth rate) which appears to be a good match to the overall trend.
Panel 3 This presents the magnified portion (January 2020 to January 2024) of the graph in Panel 2. The “Orange” line represents “Excess Deaths” which is calculated by subtracting Expected Deaths from Official Deaths. Excess Deaths peaked at 1,395 during the week ending December 30, 2020 (50 percent higher than previous historical spikes) less than a month before the Covid-19 injections were initiated.
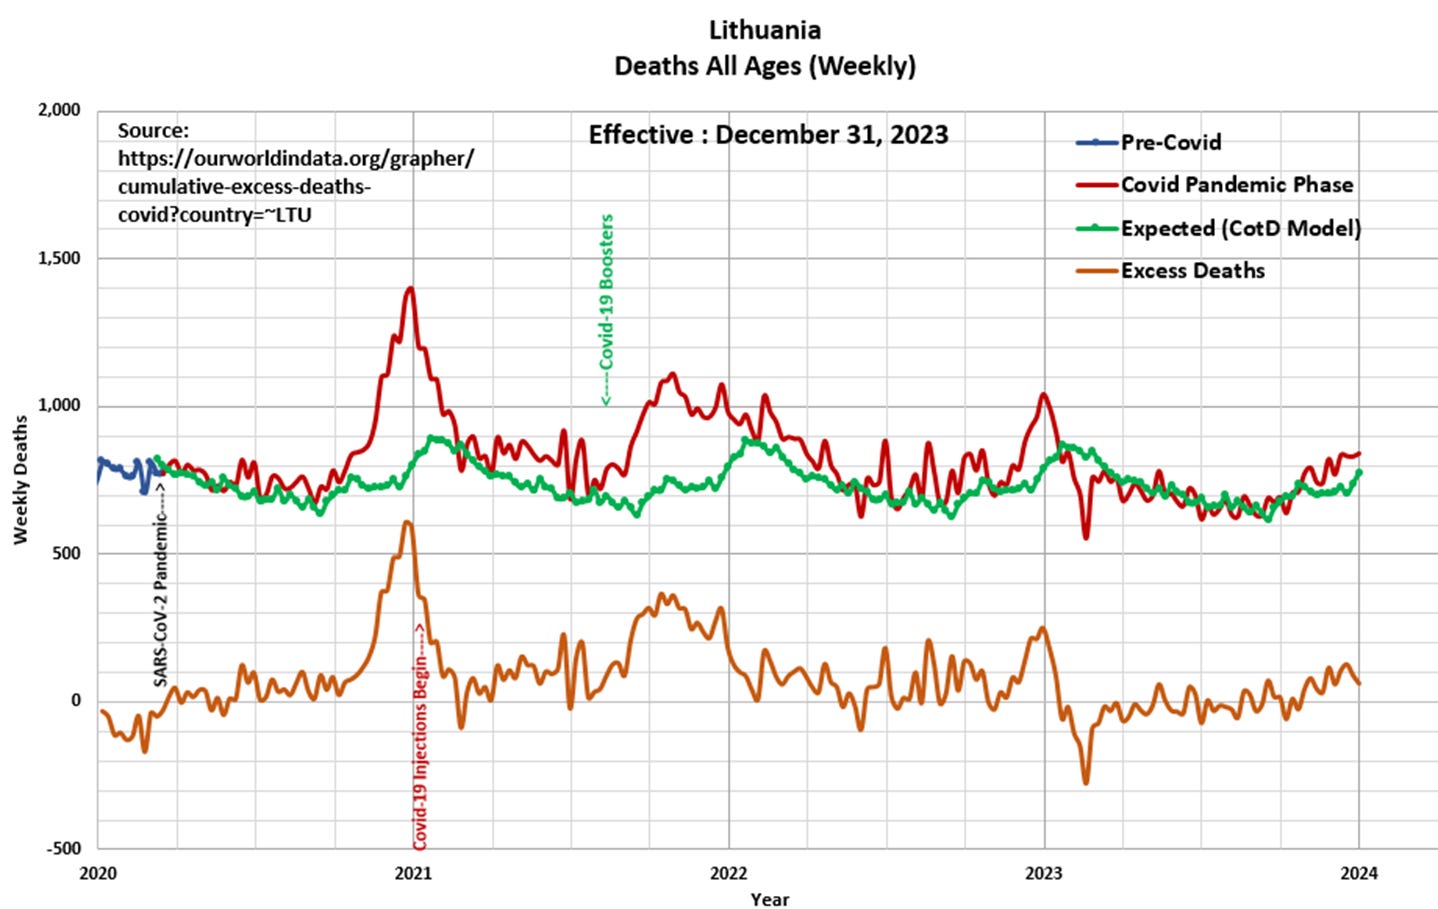
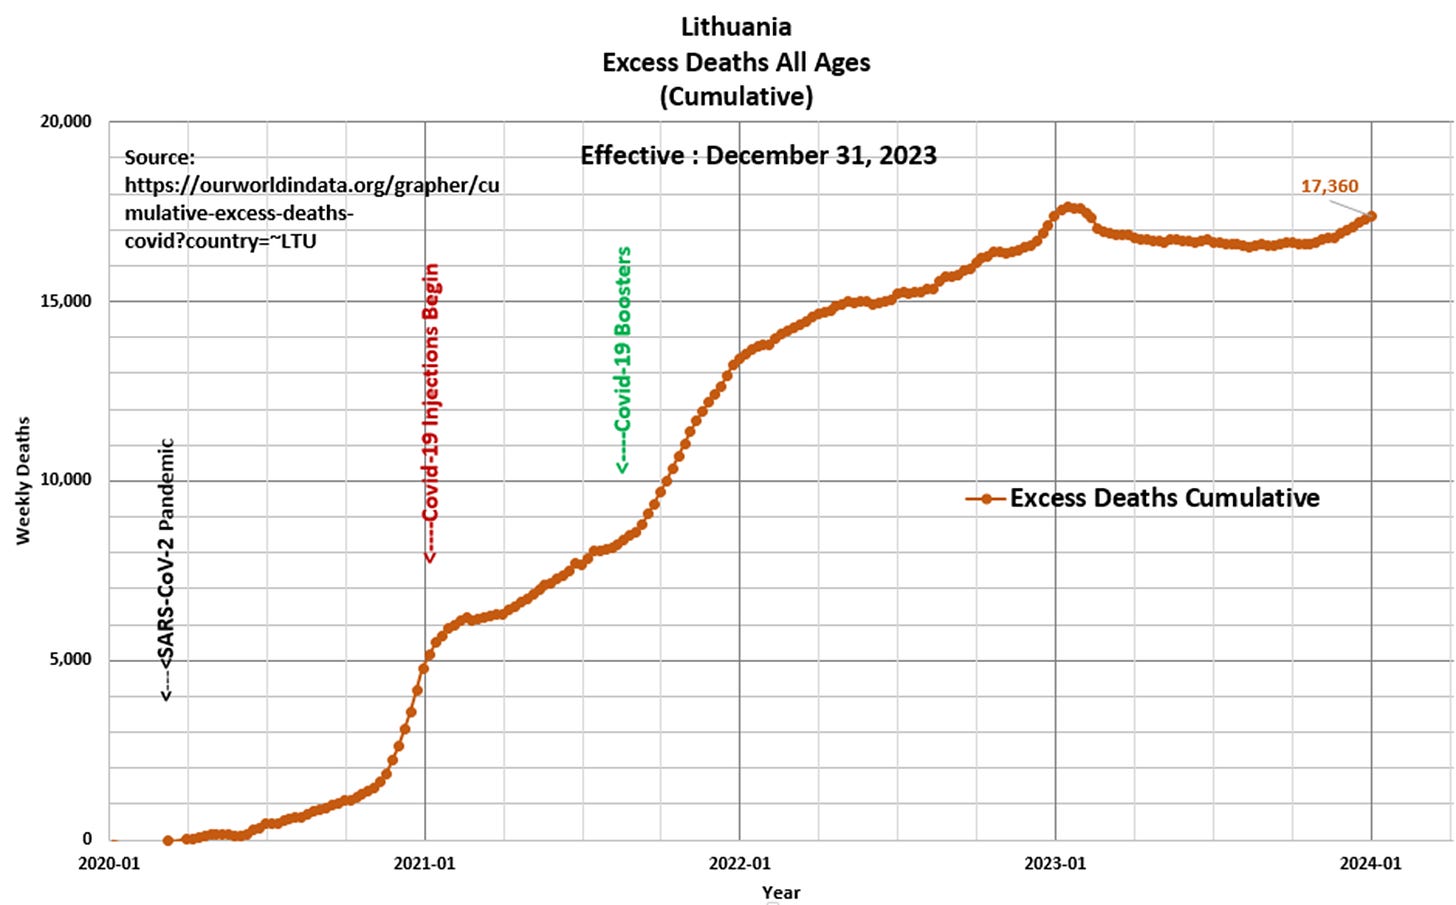
Panel 4 Based on the data and this author’s model 17,360 Excess Deaths have occurred since the start of the pandemic, of which 11,867 Excess Deaths (68 percent) have occurred since the start of Covid-19 injections in January 2021. This compares to 26,044 Excess Deaths since the start of the pandemic as per the ourworldindata.org website.
“The obvious is that which is never seen until someone expresses it simply” Khalil Gibran
Support Eldric Vero Substack
Quaecumque vera


