by Eldric Vero
July 5, 2024
This CotD was inspired by two articles:
1) Reuters Nov.15, 2021 “Egypt introduces ban on unvaccinated public sector employees” see link: https://www.reuters.com/world/middle-east/egypt-introduces-ban-unvaccinated-public-sector-employees-2021-11-15/ . From the article: ” A ban on public sector employees entering their offices if they are unvaccinated and untested for COVID-19 took effect in Egypt on Monday as the government pushes to accelerate vaccination rates in the final weeks of the year. Public university students are also barred from campuses if not vaccinated, according to government rules. Those public employees who are unvaccinated need to submit a PCR test weekly.
2) Statista March 27, 2024 “Impact of coronavirus (COVID-19) on projected real GDP growth in Egypt in 2019 and 2023 ” see link: https://www.statista.com/statistics/1169709/impact-of-covid-19-on-projected-real-gdp-growth-in-egypt/ . From the article: The coronavirus (COVID-19) pandemic is going to have repercussions on most of the countries worldwide, as is the case for Egypt as well. The Gross Domestic Product (GDP) was grew by 3.6 percent in 2020 and was estimated to grow 3.3 percent in 2021. In fact, Egypt was one of the few African countries showing a positive real GDP growth rate and the only in the North African region in 2020, regardless of the negative effects of the pandemic. Moreover, it is projected that in 2022 the Egyptian real GDP would grow by 5.7 percent.
The author of the CotD has combined analyses of Covid-19 and Excess Deaths (all causes) as these are related.
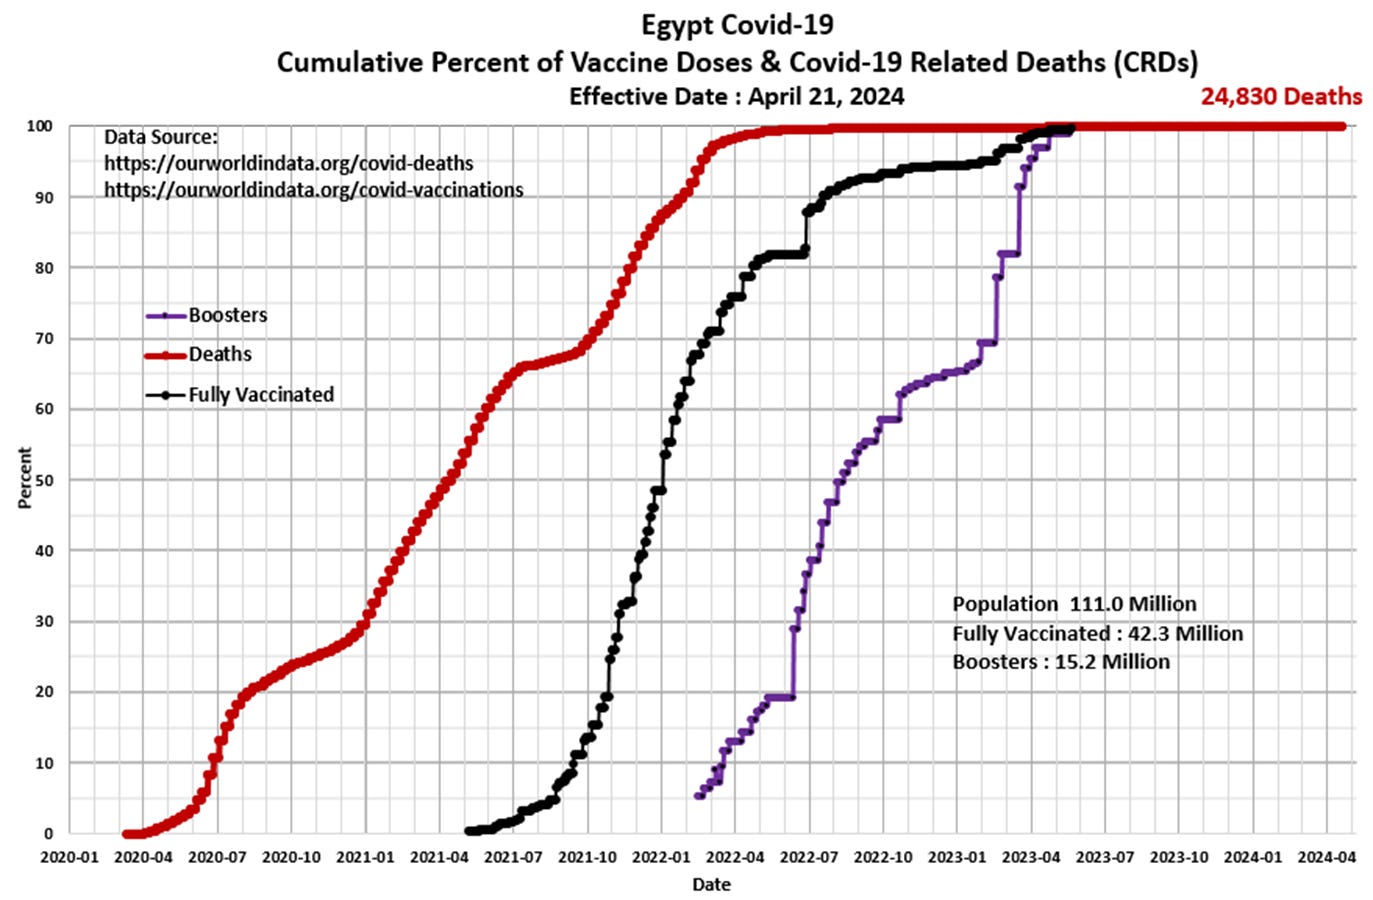
Panel 1 The first graph is a construct by the author as a standard CotD presentation which illustrates Covid-19 related deaths (CRDs) and vaccinations. Egypt’s Covid-19 Related Death (CRD) rate was high from the outset of the SARS-CoV-2 pandemic in March 2020. The vaccination program started in Q2’2021 with relatively high injection uptake rates into mid-2022 with little to no impact on the CRD rate curve. By mid-2022, in the order of 99 percent of the CRDs had occurred. The vaccination-to-deaths correlation is somewhat evident from Q2’2021 to Q2’2022, however, there appears to be room for interpretation after 2022 as the CRD rate is essentially zero.

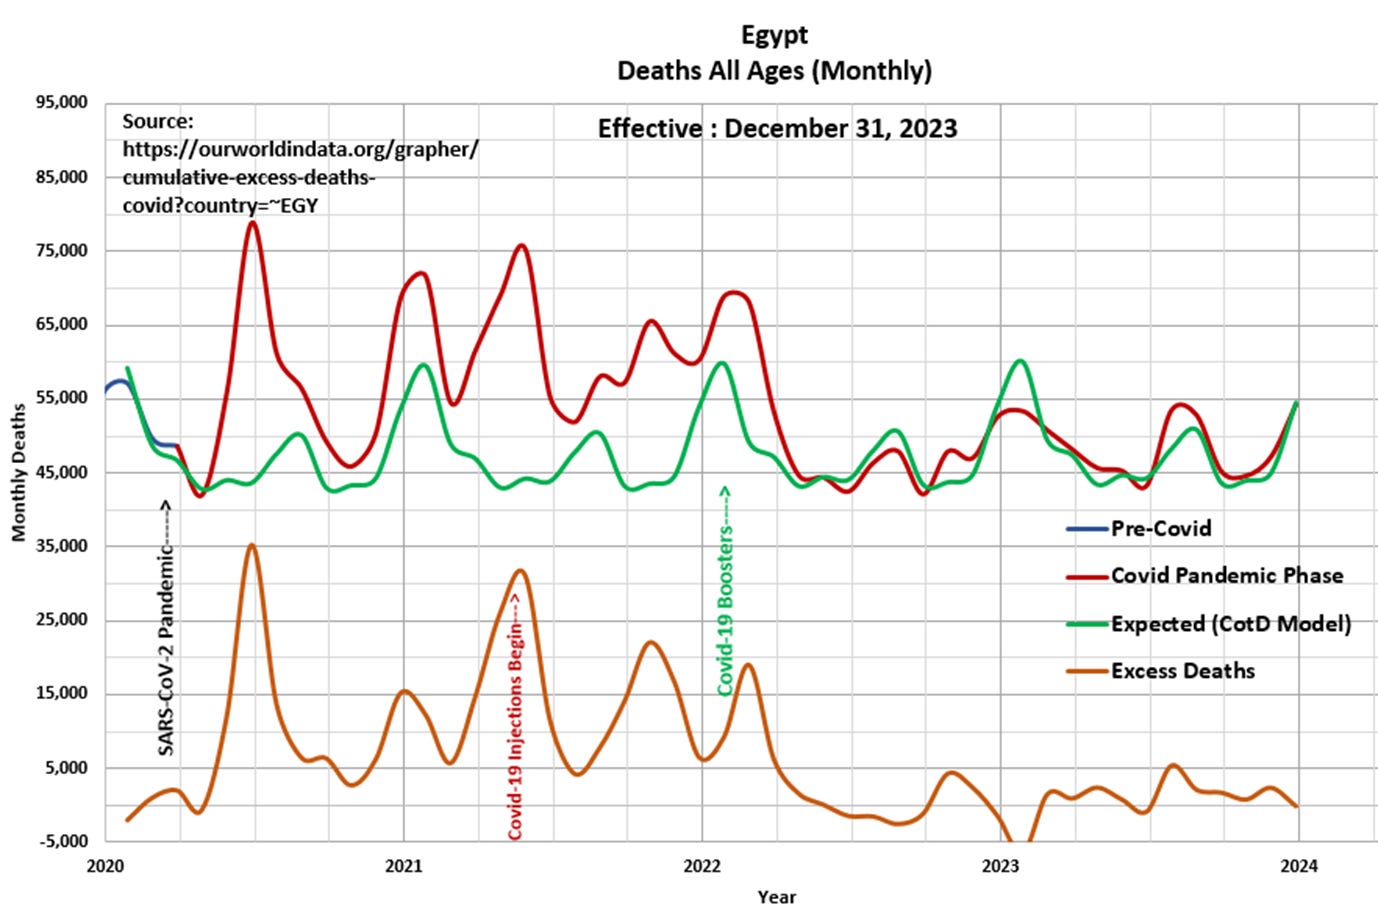
Panel 2 Observe the heterogeneous cyclical nature of deaths or all-cause mortality since 2015. The “Blue” line represents data prior to March 2020 and the “Red” line represents data since the SARS CoV-2 pandemic was initiated in March 2020. The “Green” line represents the “Expected” deaths (CotD Model) based on historical averages. Data for the five year period January 2015 to December 2019 was utilized in order to calculate an average normalized curve for Monthly Deaths. The Expected (CotD Model) deaths incorporates an average 2.0 percent growth factor which appears to be a good match to the overall pre-pandemic trend.

Panel 3 This presents the magnified portion (January 2020 to December 2023) of the graph in Panel 2. The “Orange” line represents “Excess Deaths” which is calculated by subtracting Expected Deaths (CotD Model) from Official Deaths.

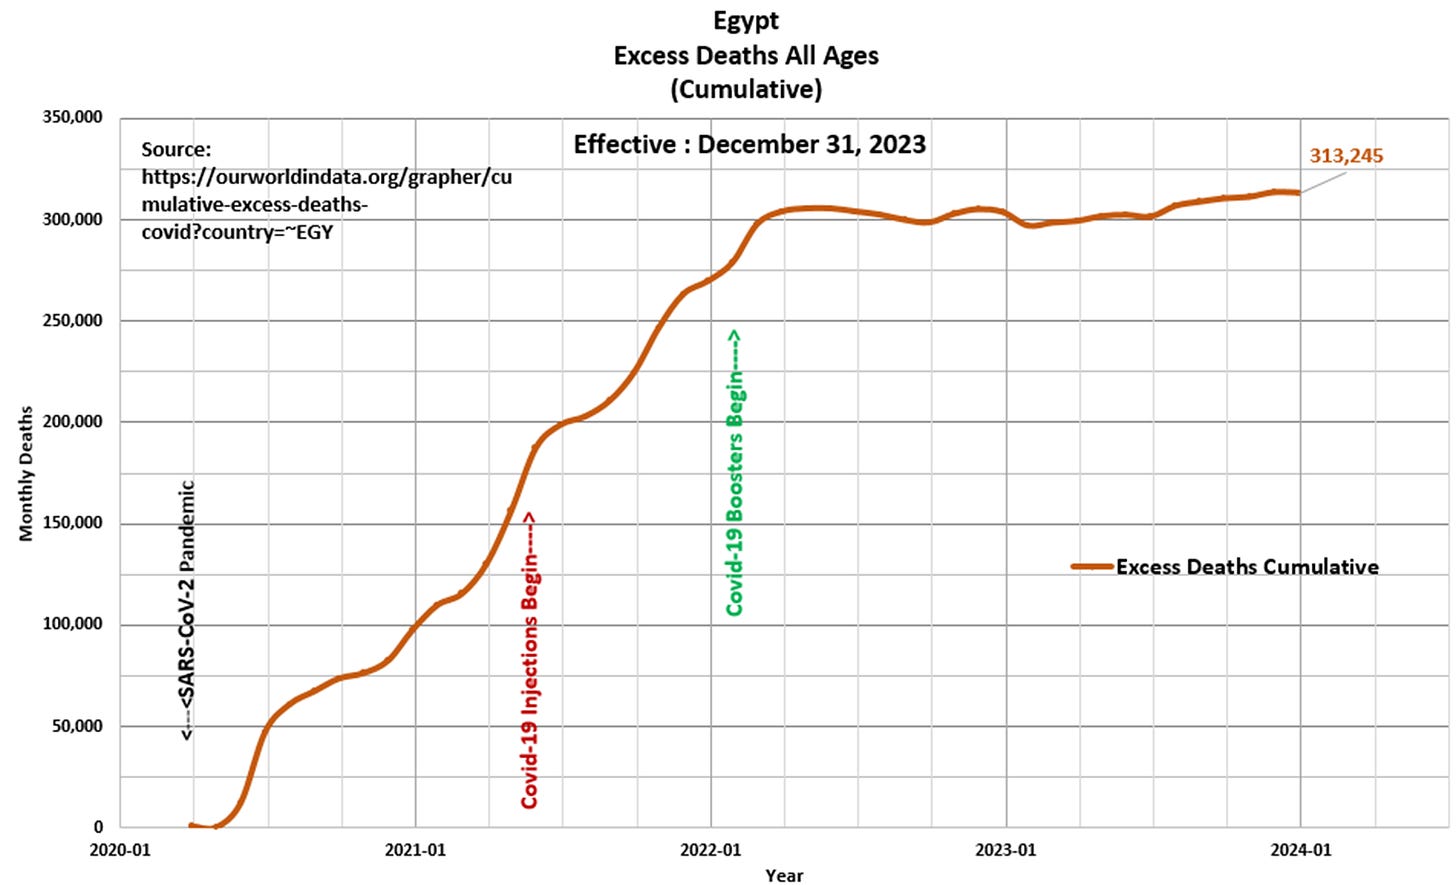
Panel 4 Based on the data and this author’s model, there have been 313,245 Excess Deaths since the start of the pandemic of which essentially 50 percent have occurred since the start of Covid-19 injections in February 2021. This compares to 357,925 Excess Deaths since January 2020 as per the https://ourworldindata.org/grapher/cumulative-excess-deaths-covid?country=~EGY website.

“Whoever lets himself be led by the heart will never lose his way” Egyptian Proverb


