Chart of the Day (CotD) Portugal Covid and Excess Deaths,
by Eldric Vero
July 10, 2024
This CotD was inspired by the following:
1) The Portugal News November 27, 2020 “Covid PCR test reliability doubtful – Portugal judges” (see link: https://www.theportugalnews.com/news/2020-11-27/covid-pcr-test-reliability-doubtful-portugal-judges/56962 ). As per the article: The PCR test “is unable to determine, beyond reasonable doubt, that a positive result corresponds, in fact, to the infection of a person by the SARS-CoV-2 virus”, said the Lisbon Court of Appeal. The judges quoted a paper published in The Lancet by Elena Surkova, Vladyslav Nikolayevskyy and Francis Drobniewski, which stated: “Any diagnostic test result should be interpreted in the context of the pretest probability of disease. For COVID 19, the pretest probability assessment includes symptoms, previous medical history of COVID-19 or presence of antibodies, any potential exposure to COVID-19, and likelihood of an alternative diagnosis. When low pretest probability exists, positive results should be interpreted with caution and a second specimen tested for confirmation.
2) Time March 11, 2024 “Experts Can’t Agree If We’re Still in a Pandemic” (see link: https://time.com/6898943/is-covid-19-still-pandemic-2024/ ). As per the article: “There is no universal, agreed definition of what a pandemic is,” Van Kerkhove says. “If you asked 100 epidemiologists to define what a pandemic is, or, ‘Are we currently in a pandemic?’ you’d get a lot of different answers.” Lots of people stopped paying attention long before COVID-19’s four-year anniversary, and “the pandemic is over for them” regardless of how much experts debate the right vocabulary to use, Osterholm says.
The author of the CotD has combined analyses of Covid-19 and Excess Deaths (all causes) as these are related.
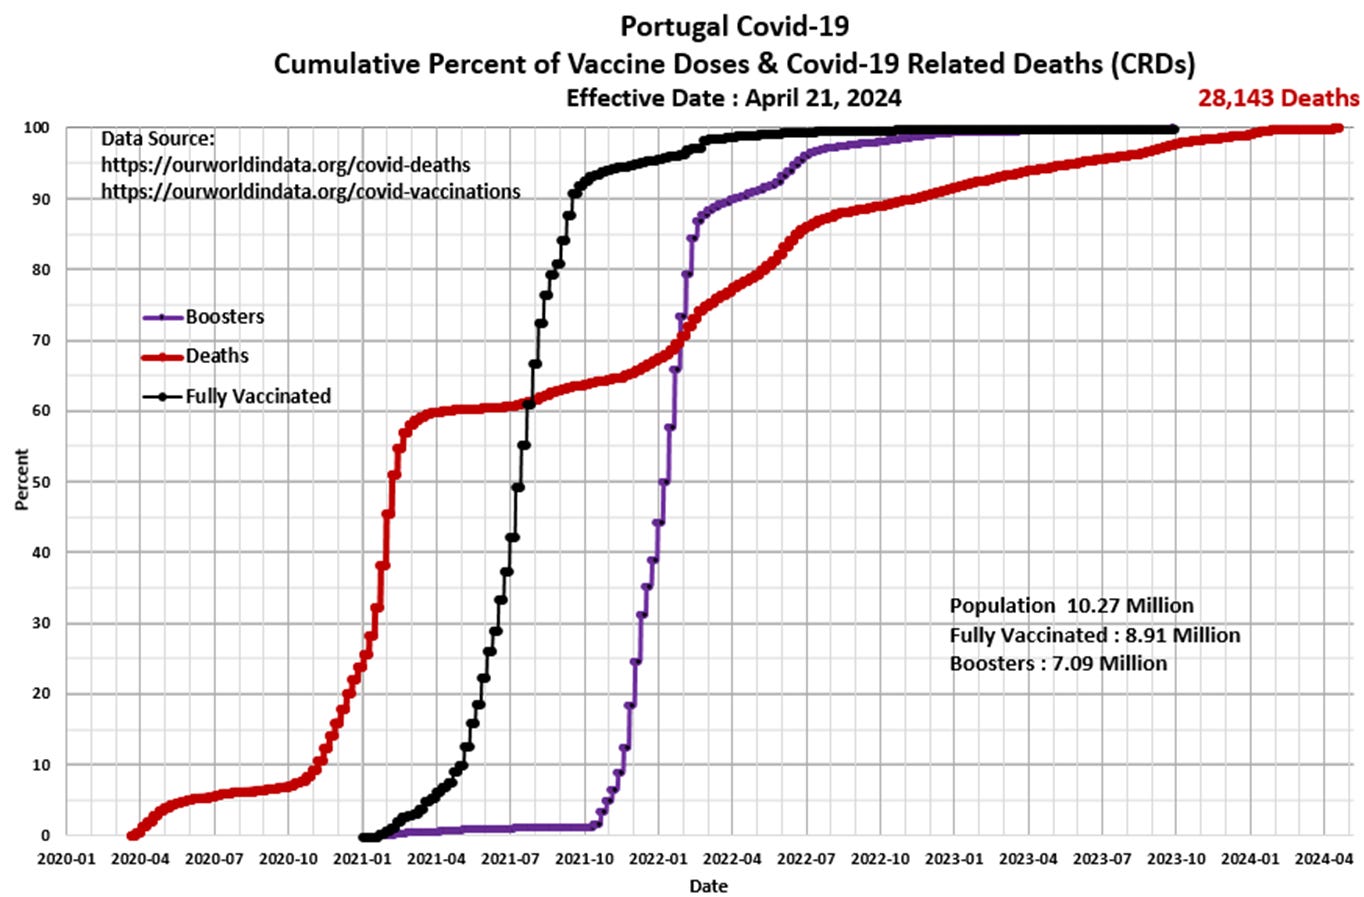
Panel 1 The first graph is a construct by the author as a standard CotD presentation which illustrates Covid-19 related deaths (CRDs) and vaccinations. The CRD rate was extremely high in Q4’2020 and into Q1’2021 with the CRD rate flattening somewhat in Q2’2021 to a relatively low rate. The vaccination program began in Q1’2021, however, it is likely there was limited impact on the already low CRD rate. The CRD rate continued to rise at a relatively high rate into mid-2022 after some 86 percent of the population had been fully vaccinated plus 67 percent had been boosted. The vaccine-to-death correlation is in plain view, however there is room for interpretation. The CRD rate has subsided significantly since 2023 as vaccination/booster uptake rates have declined to near zero percent.

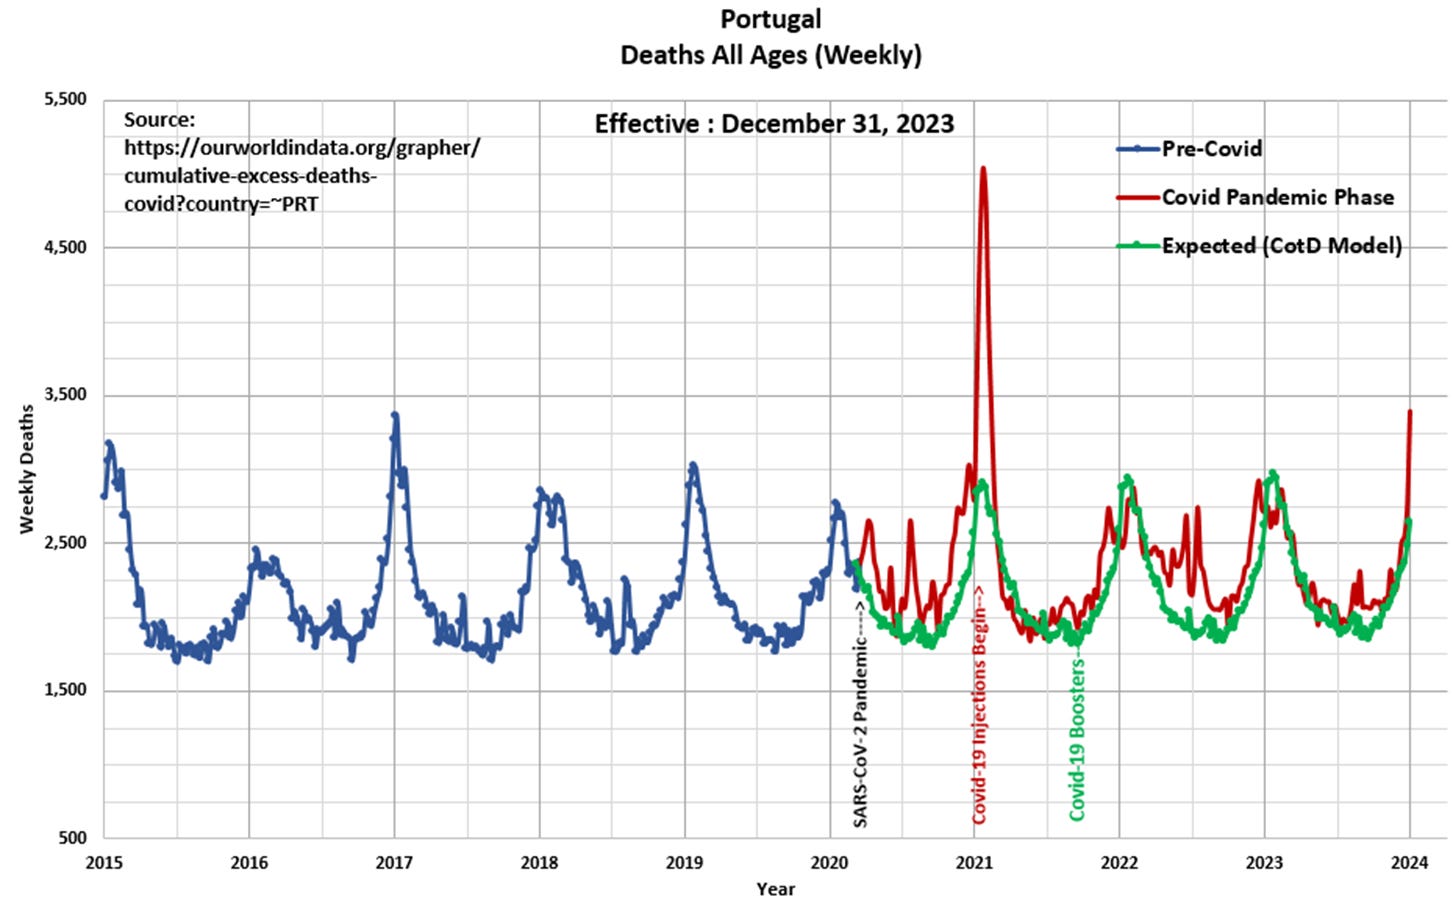
Panel 2 Observe the characteristic cyclical nature of deaths or all-cause mortality since 2015. The “Blue” line represents data prior to March 2020 and the “Red” line represents data since the SARS CoV-2 pandemic was initiated in March 2020. The “Green” line represents the “Expected” deaths (CotD Model) based on historical averages. The author has utilized the five year period January 2015 to December 2019 in order to calculate an average normalized curve for Weekly Deaths. The Expected (CotD Model) deaths incorporates an average 3.0 percent growth factor which appears to be a good match to the overall trend.

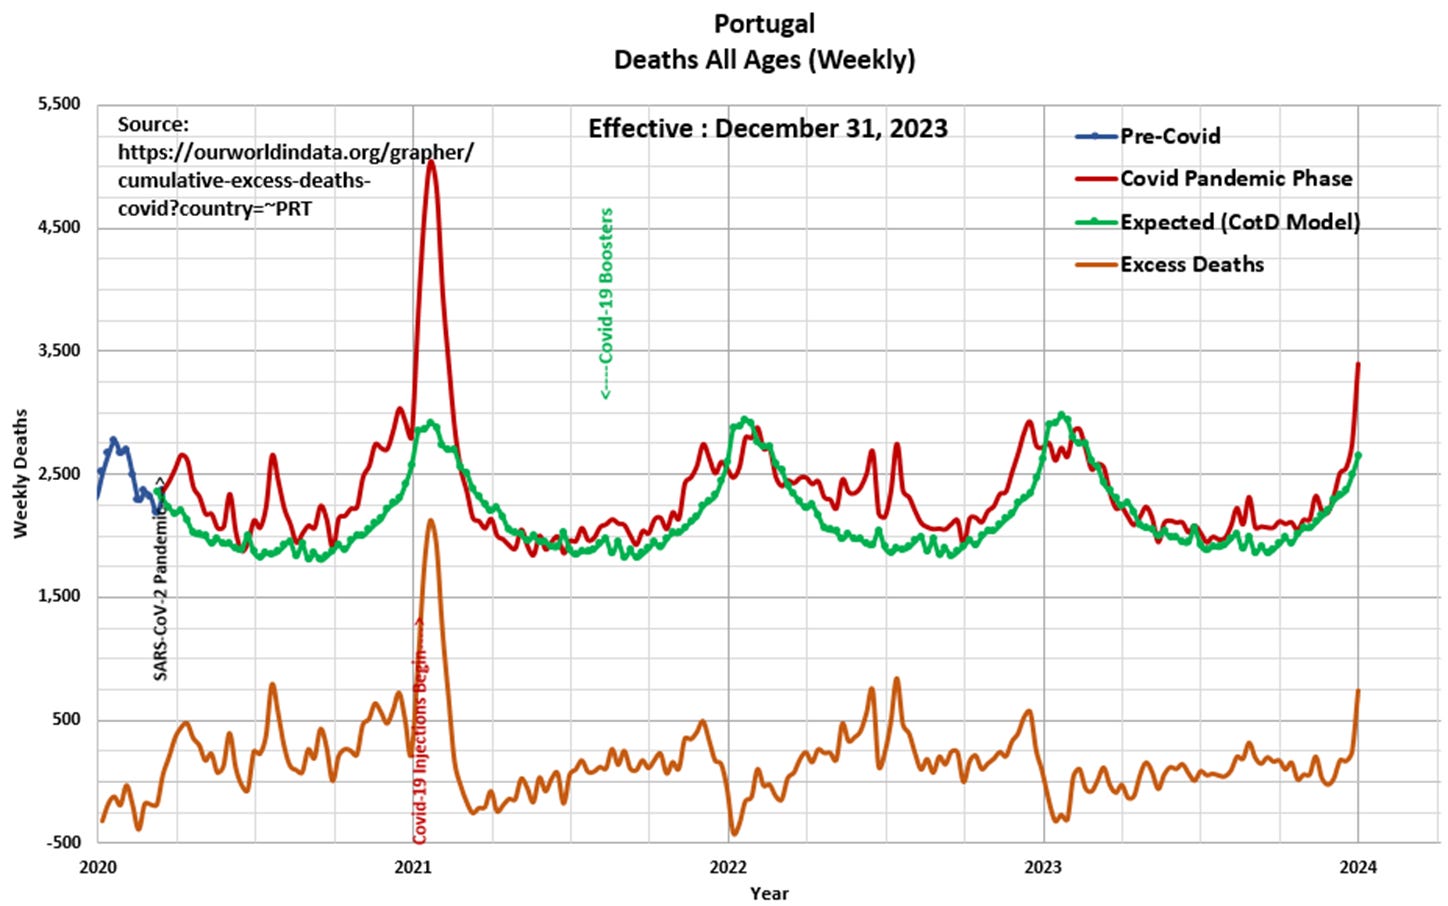
Panel 3 This presents the magnified portion (January 2020 to January 2024) of the graph in Panel 2. The “Orange” line represents “Excess Deaths” which is calculated by subtracting Expected Deaths from Official Deaths. Weekly deaths peaked at 5,044 during the week ending January 21, 2021 (75 percent higher than previous historical spikes) less than a month after the Covid-19 injections were initiated.

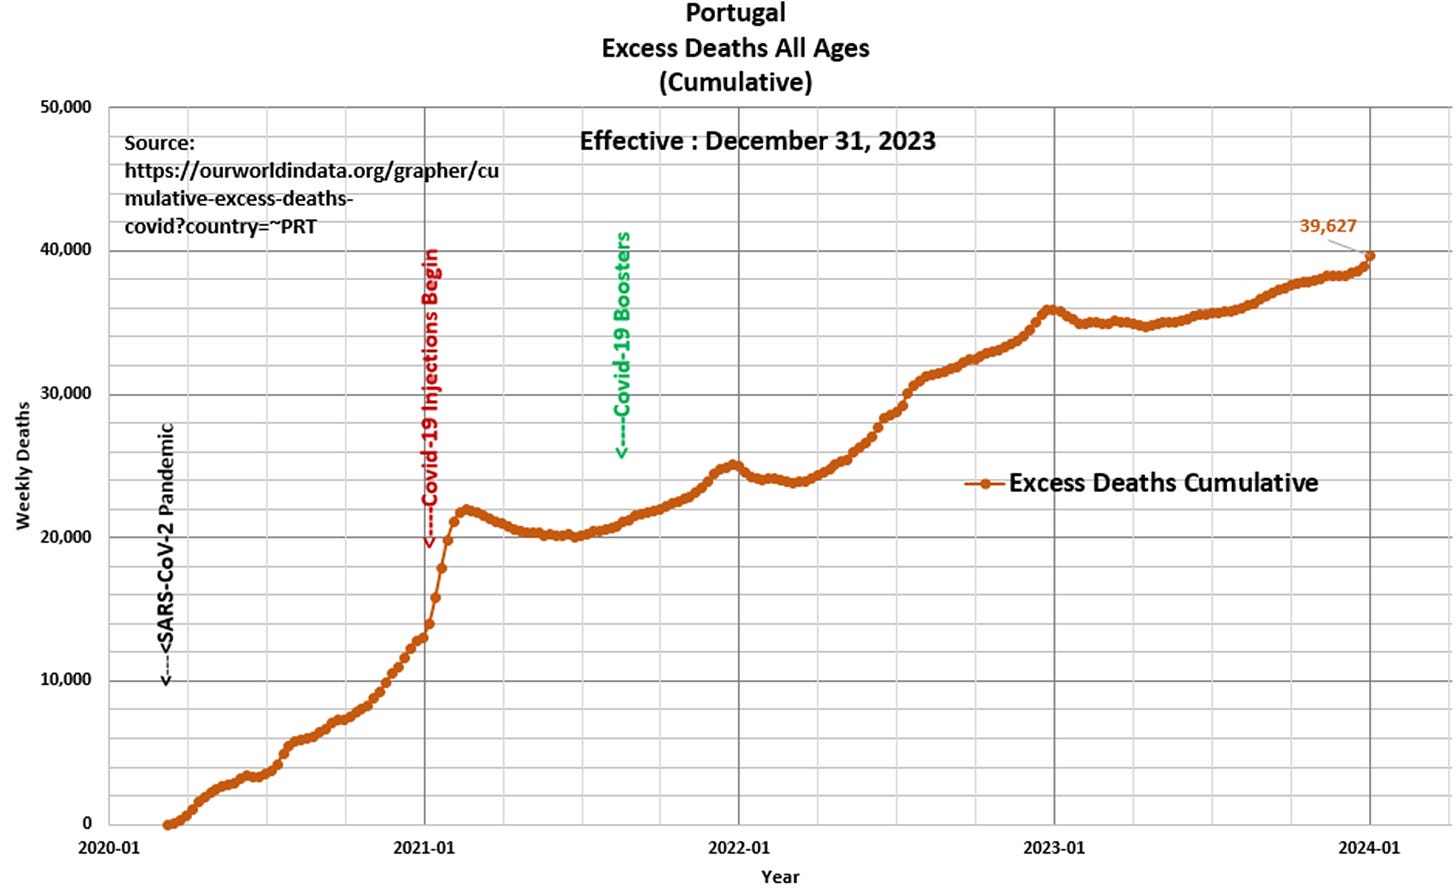
Panel 4 Based on the data and this author’s model 39,627 Excess Deaths have occurred since the start of the pandemic, of which 25,672 Excess Deaths (65 percent) have occurred since the start of Covid-19 injections in January 2021. This compares to 33,277 Excess Deaths since the start of the pandemic as per the ourworldindata.org website.

“The truth is out there” The X-Files


