by Eldric Vero
July 15, 2024
The following articles are relevant to this CotD:
1) Health-E News May 23, 2024 “South Africa Bullied By Big Pharma In COVID-19 Vaccines Contract Negotiations” (see link: https://health-e.org.za/2024/05/23/south-africa-bullied-by-big-pharma-in-covid-19-vaccines-contract-negotiations/ ). As per the article: “South Africa gave up millions of dollars to secure vaccine doses that had no certainty of reaching its residents in a timely manner. Government officials tried to include revisions that would have allowed for oversight by lawmakers and executive officials but none were included in the final agreement”. Pfizer obtained iron clad confidentiality protections to safeguard its profits in the future and refused any and all flexibilities for public health which is unacceptable. “So what becomes clear after reviewing these documents is that concentrated private power in public health emergencies allows pharmaceutical companies to seek and impose unjust terms on other nations. The consequences of their profit maximising motive are felt most harshly by those in low- and middle-income countries”.
2) UNILAD News July 13, 2024 “Study reveals ‘scary’ sign of COVID that can be found in the body years after infection” (see link: https://www.unilad.com/technology/covid-19-coronavirus-signs-of-virus-in-body-years-after-infection-588312-20240713 ). As per the article: A new study followed 24 Covid patients over a period of up to 900 days has revealed T cells may be a larger factor in the disease than previously thought. T cells are a type of white blood cell that are part of the immune system and develop from stem cells in the bone marrow. Other scans showed activated T cells swarming to the gut wall, prompting the team to analyze gut biopsies. Again, they found the presence of COVID-19 RNA – a “long-term virus reservoir.” While this is a step forward, according to the scientists, it is not exactly a slam dunk as it isn’t clear what the T cells are reacting to, whether they are responding to remnants of the infection or dealing with active particles.
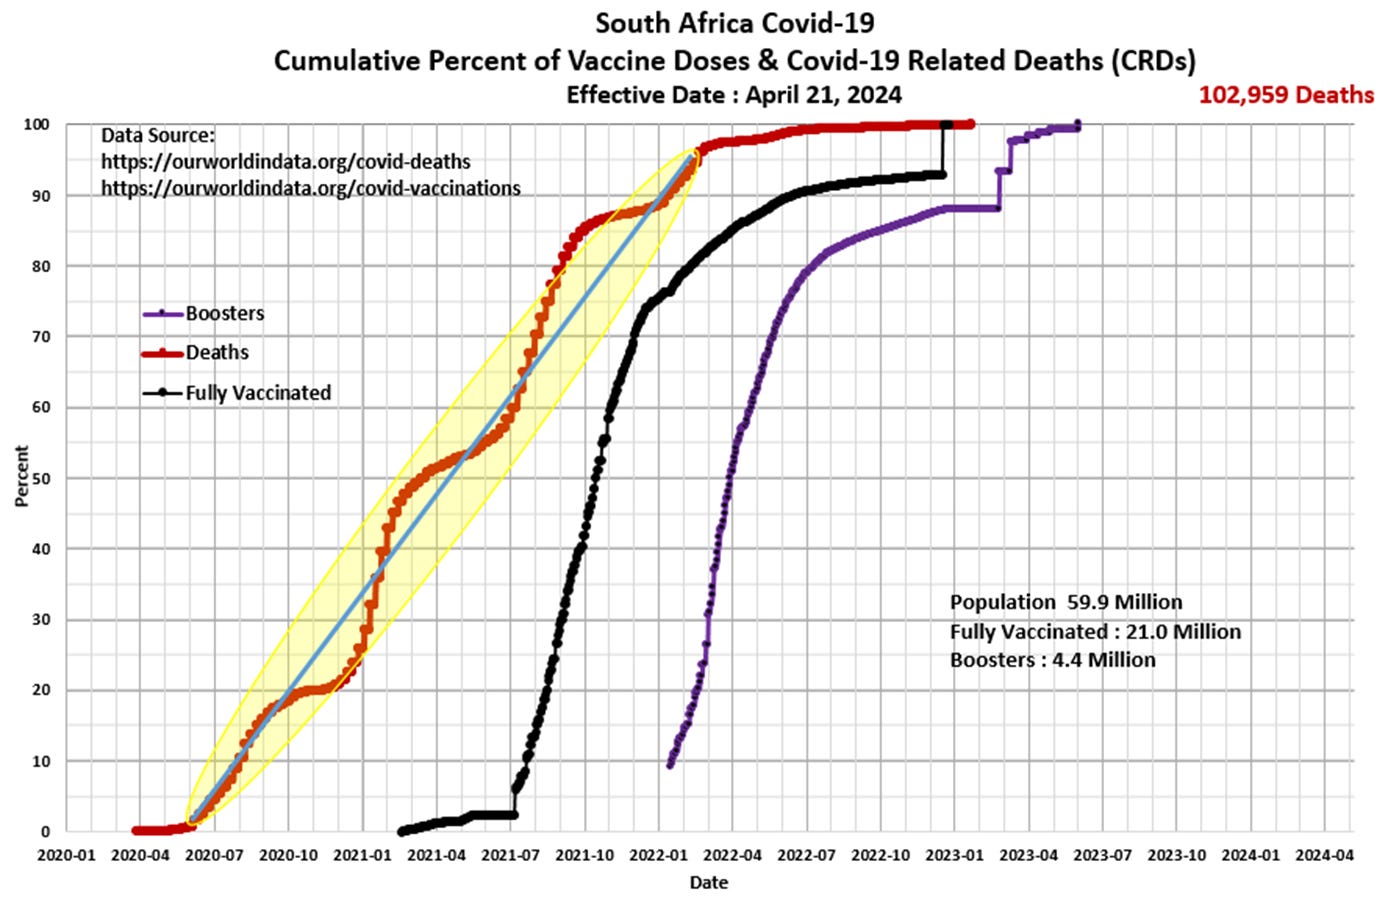
The author of the CotD has combined analyses of Covid-19 and Excess Deaths (all causes) as these are related.
Panel 1 The first graph is a construct by the author as a standard CotD presentation which illustrates Covid-19 related deaths (CRDs) and vaccinations. The CRD rate was essentially zero from the outset of the SARs-CoV-2 pandemic in March 2020, however, the CRD took-off at a very high rate by June 2020. The vaccination program began in February 2021 with accelerated injection rates into Q1’2022. The booster program was initiated in January 2022 with high injection rates into Q3’2022. There may be a case for a vaccine-to-death correlation starting in mid-2021, however, there appears to be room for interpretation. Note the CRD rate started to level-off in Q1’2022 and eventually reached zero by early 2023 as the vaccine/booster uptake waned. Note that 35 percent of the population was fully vaccinated and less than 8 percent boosted. Total CRDs to date represents 0.17 percent of the population.

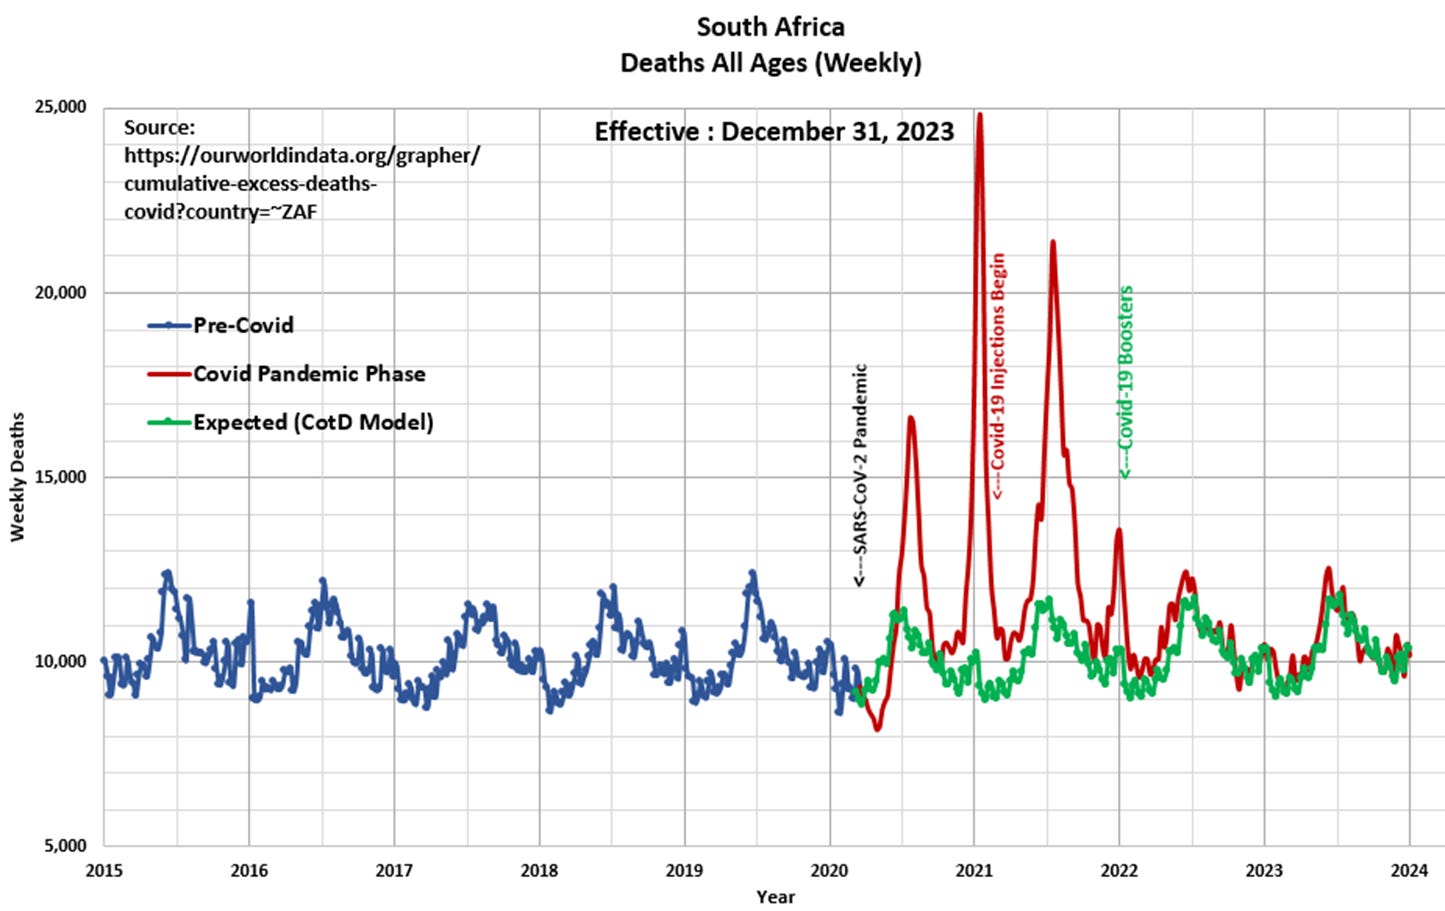
Panel 2 Observe the cyclical nature of deaths or all-cause mortality since 2015. The “Blue” line represents data prior to March 2020 and the “Red” line represents data since the SARS CoV-2 pandemic was initiated in March 2020. The “Green” line represents the “Expected” deaths (CotD Model) based on historical averages. The author has utilized the five year period January 2015 to December 2019 in order to calculate an average normalized curve for Weekly Deaths. The Expected (CotD Model) deaths incorporates an average 1.0 percent growth factor which appears to be a good match to the overall trend.

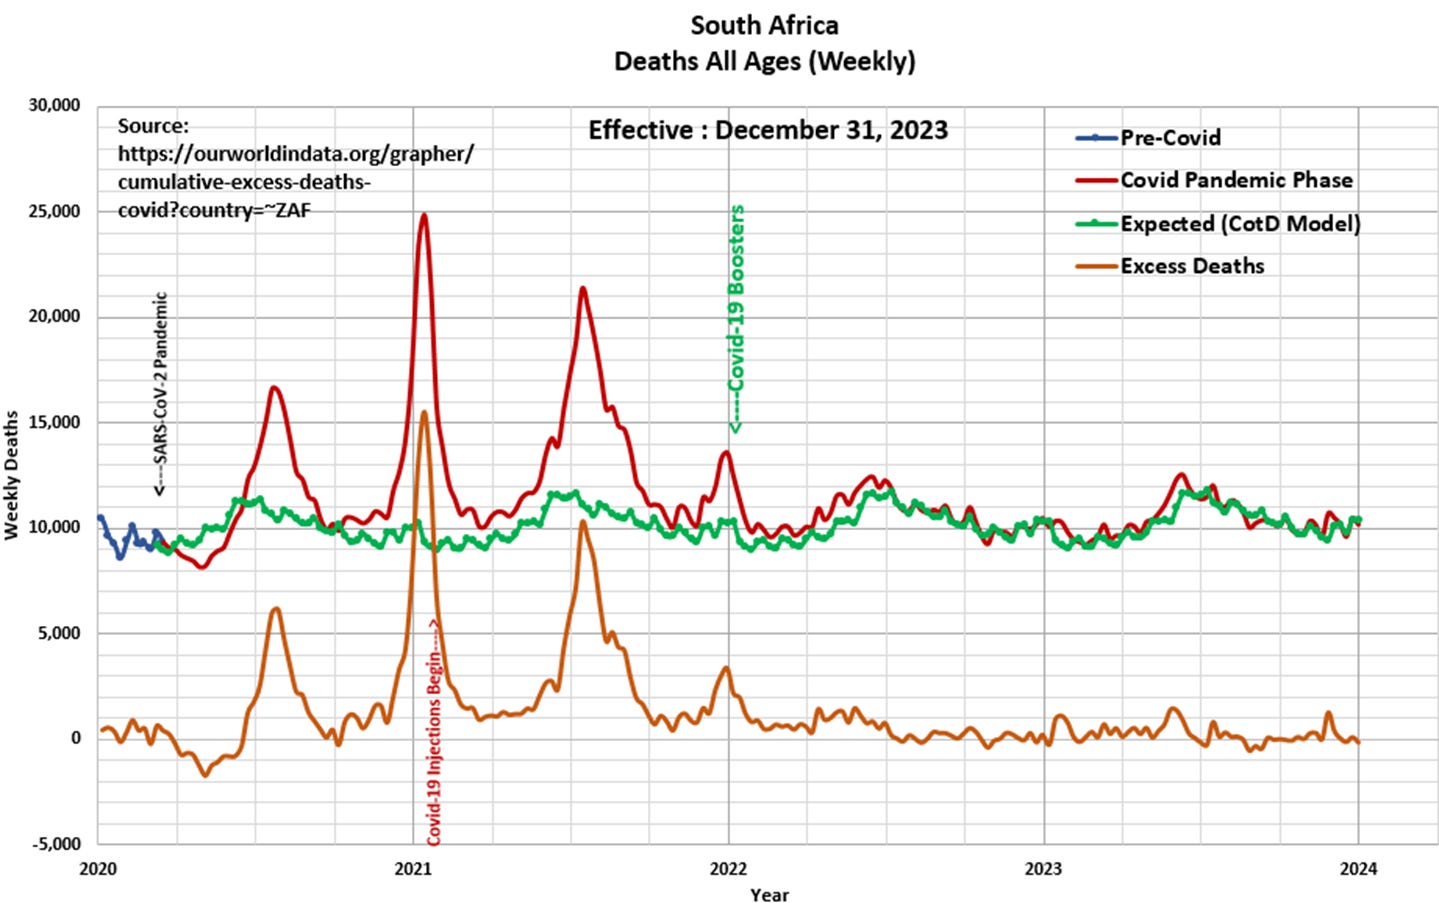
Panel 3 This presents the magnified portion (January 2020 to January 2024) of the graph in Panel 2. The “Orange” line represents “Excess Deaths” which is calculated by subtracting Expected Deaths from Official Deaths. Weekly deaths peaked at 24,842 during the week ending January 14, 2021 which is 100 percent higher than previous historical spikes.

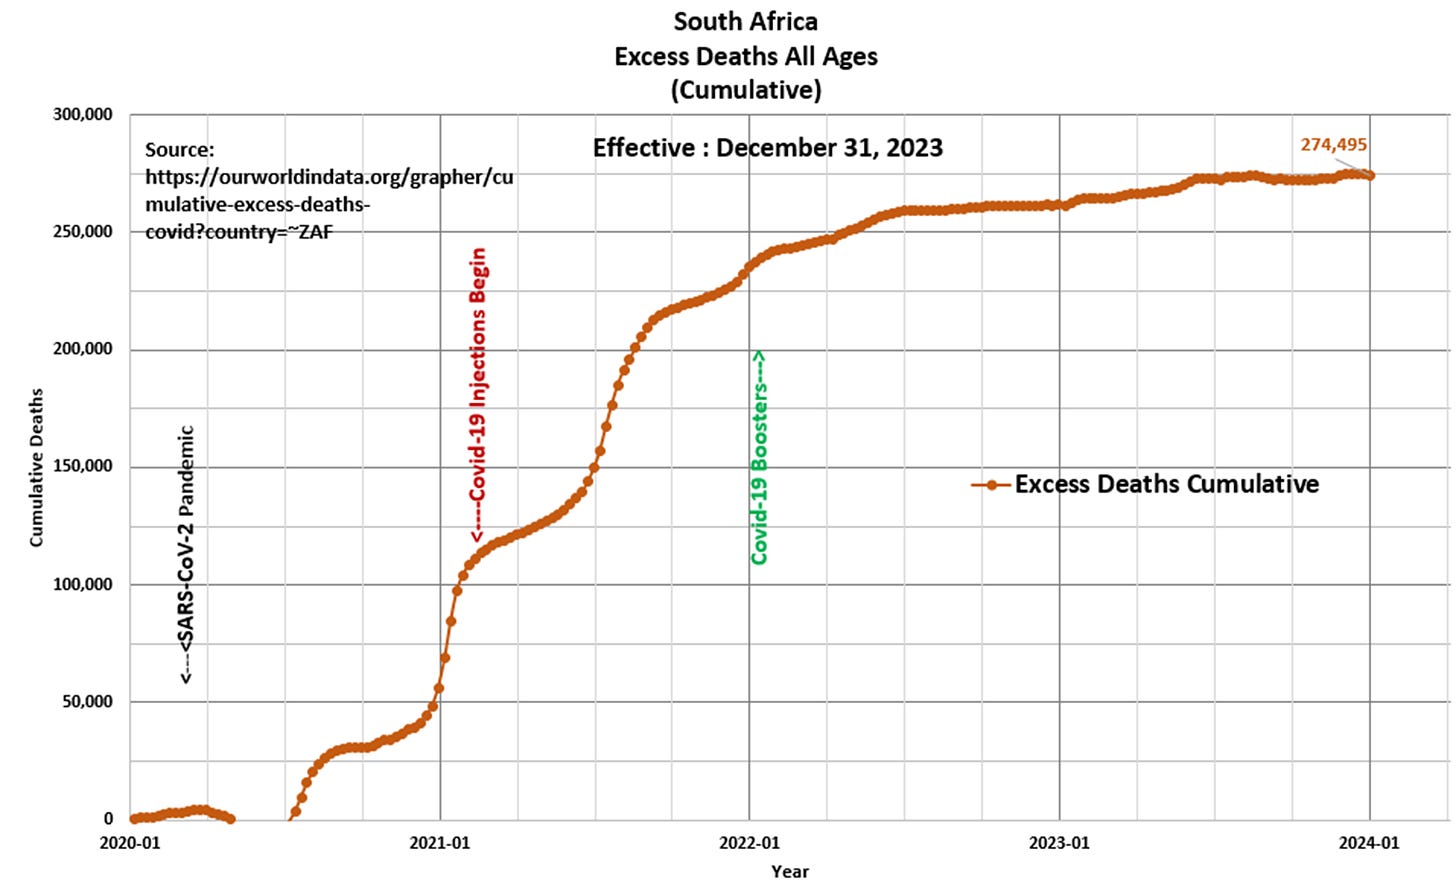
Panel 4 Based on the data and this author’s model 274,495 Excess Deaths have occurred since the start of the pandemic, of which 165,975 Excess Deaths (60 percent) have occurred since the start of Covid-19 injections in February 2021. This compares to 309,068 Excess Deaths since the start of the pandemic as per the ourworldindata.org website.

“It is not what you are called…but what you answer to that matters” African Proverb


