by Eldric Vero
July 19, 2024
The following articles are relevant to this CotD:
1) Visit Greenland May 27, 2021 “Covid-19 Has Made the Population More Positive Towards Tourists” (see link: https://traveltrade.visitgreenland.com/latest-news/covid-19-has-made-the-population-more-positive-towards-tourists/ ). As per the article: According to Visit Greenland’s Acting Director, Mads Skifte, there is a connection between the positive perception of tourists and COVID-19. “In general, Greenlanders are happy about international tourists; we saw this even before COVID-19 hit. Now that we have experienced a whole year largely without tourists, it has become clear how much influence guests actually have in the local community. Therefore, residents seem excited to get them back, when this can be done responsibly for both guests and locals,” he says.
2) National Library of Medicine July 20, 2023 “The COVID-19 pandemic in Greenland, epidemic features and impact of early strict measures, March 2020 to June 2022” (see link: https://www.ncbi.nlm.nih.gov/pmc/articles/PMC10360370/ ). As per the article: SARS-CoV-2 circulation in Greenland was low, given strict restrictions until all eligible inhabitants had been offered immunization. The main impact of the pandemic was from May 2021 onwards with increasing numbers of confirmed cases. This occurred after introduction of the vaccine program, which may have had an influence on the severity of the associated morbidity and mortality experienced.
The author of the CotD has combined analyses of Covid-19 and Excess Deaths (all causes) as these are related.
Panel 1 The first graph is a construct by the author as a standard CotD presentation which illustrates Covid-19 related deaths (CRDs) and vaccinations. The CRD rate was zero from the outset of the SARs-CoV-2 pandemic in March 2020 until late December 2021 (i.e for just under 2 years, there was no pandemic in Greenland). The vaccination program began in March 2021 with accelerated injection rates into Q4’2021. The first CRD occurred in December 2021 or about 8 months after the covid injections were initiated. The vaccines-to-deaths correlation is stunning to say the least as 21 citizens died in a matter of 3 months in Q1’2022. In a relative sense, this CRD rate is one of the most extreme the CotD author has encountered so far. There is no data beyond April 2022 within the ourworldindata.org database.

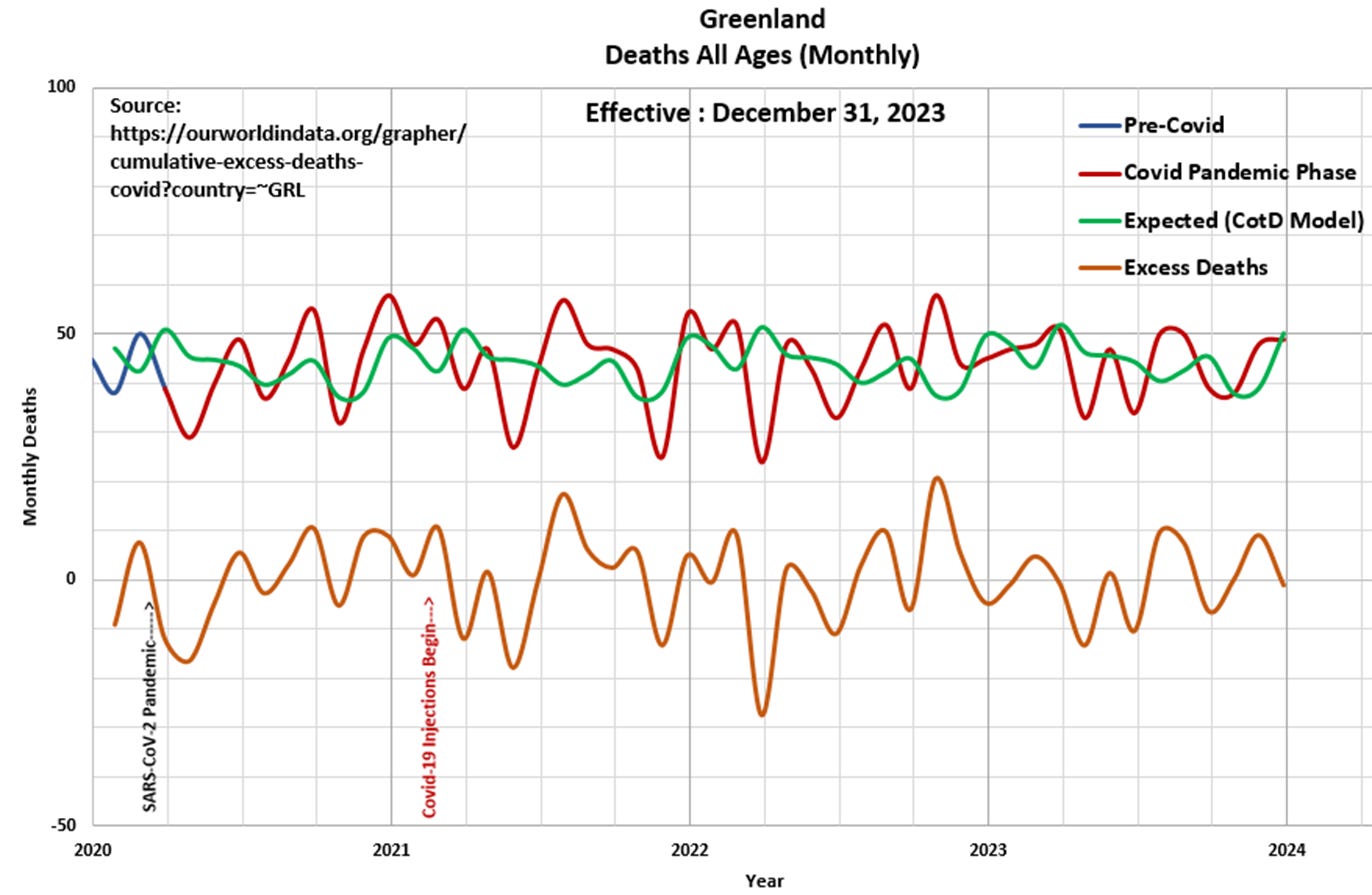
Panel 2 Observe the heterogeneous cyclical nature of deaths or all-cause mortality since 2015. The “Blue” line represents data prior to March 2020 and the “Red” line represents data since the SARS CoV-2 pandemic was initiated in March 2020. The “Green” line represents the “Expected” deaths (CotD Model) based on historical averages. The author has utilized the five year period January 2015 to December 2019 in order to calculate an average normalized curve for Weekly Deaths. The Expected (CotD Model) deaths incorporates an average 6.0 percent growth factor which appears to be a good match to the overall trend. Due to the Greenland’s small-scale population, the data presents as relatively “noisy” and does leave room for interpretation.

Panel 3 This presents the magnified portion (January 2020 to January 2024) of the graph in Panel 2. The “Orange” line represents “Excess Deaths” which is calculated by subtracting Expected Deaths from Official Deaths. Overall, Excess Deaths have remained consistent within the CotD Model projections and it appears there is nothing out of the ordinary.

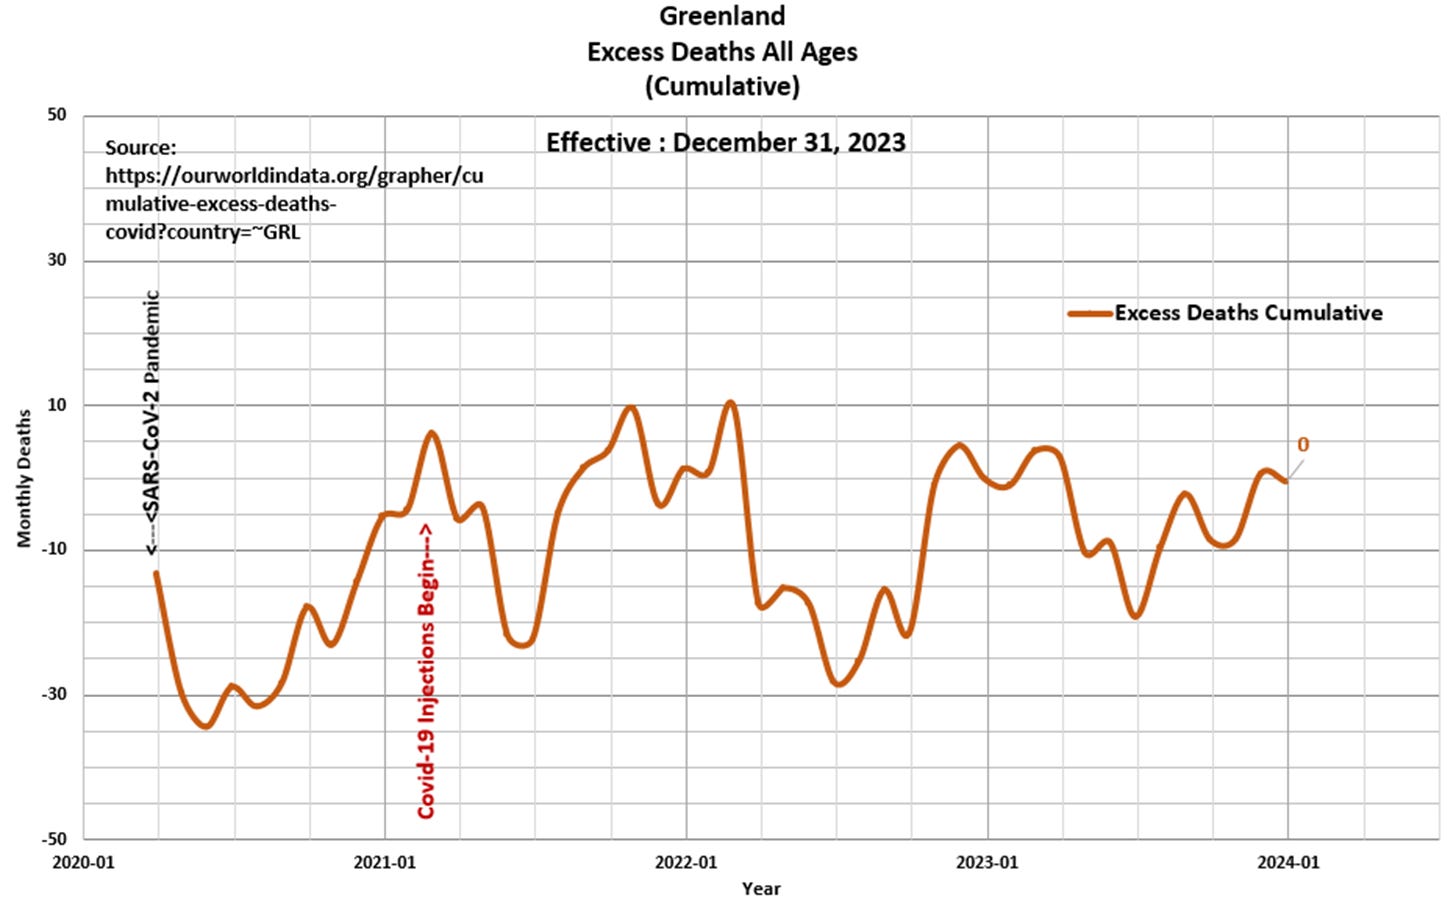
Panel 4 Based on the data and this author’s model, 0 (zero) Excess Deaths have occurred since the start of the pandemic. This compares to -166 Excess Deaths since the start of the pandemic as per the ourworldindata.org website. The CotD author has evaluated Excess Deaths in over 40 countries to date and Greenland presents a unique situation that should be investigated further.

“There are two ways to be fooled…one is to believe what isn’t true…the other is to refuse to believe what is true” Soren Kierkegaard


