Chart of the Day (CotD) Czech Republic Covid and Excess Deaths
by Eldric Vero
July 22, 2024
The following articles are relevant to this CotD:
1) Denis’s Substack July 20, 2024 “Breaking: Our largest study of its kind “Spatiotemporal variation of excess all-cause mortality in the world during the Covid period regarding socio economic factors and medical interventions”” (see link: https://substack.com/home/post/p-146825109 ). As per the article: The major causes of death globally stemmed from public health establishment’s response, including mandates and lockdowns that caused severe stress, harmful medical interventions and the vaccines. The spatiotemporal variations in national excess all-cause mortality rates allow us to conclude that the Covid-period (2020-2023) excess all-cause mortality in the world is incompatible with a pandemic viral respiratory disease as a primary cause of death. Our calculated excess mortality rate (0.392 ± 0.002 %) corresponds to 30.9 ± 0.2 million excess deaths projected to have occurred globally for the 3 year period 2020-2022, from all causes of excess mortality during this period…. for the 78 countries with sufficient data gives an estimated projected global all-ages excess mortality associated with the COVID-19 vaccine rollouts up to 30 December 2022: 16.9 million COVID-19-vaccine-associated deaths.
2) The Expose News July 18, 2024 “Czechia data shows that Moderna covid injections are more deadly than Pfizer” (see link: https://expose-news.com/2024/07/18/moderna-covid-injections-are-more-deadly-than-pfizer/ ). As per the article: Official government data obtained through a Freedom of Formation Act request from the Czech Republic shows that all-cause mortality Moderna’s covid injection was higher than after Pfizer-BioNTech’s injection by over 50%. This 50% increased mortality rate ratio between Moderna and Pfizer related to people in the 46 to 69 age group who received either two doses of Moderna or two doses of Pfizer’s covid injection. The data showed that the younger vaccine recipients were the greater the increase in risk. For 20 to 29-year-olds, for example, the mortality rate ratio of Moderna to Pfizer approached 2:1 which means youngsters more than doubled their all-cause mortality if they took a Moderna injection.
The author of the CotD has combined analyses of Covid-19 and Excess Deaths (all causes) as these are related.
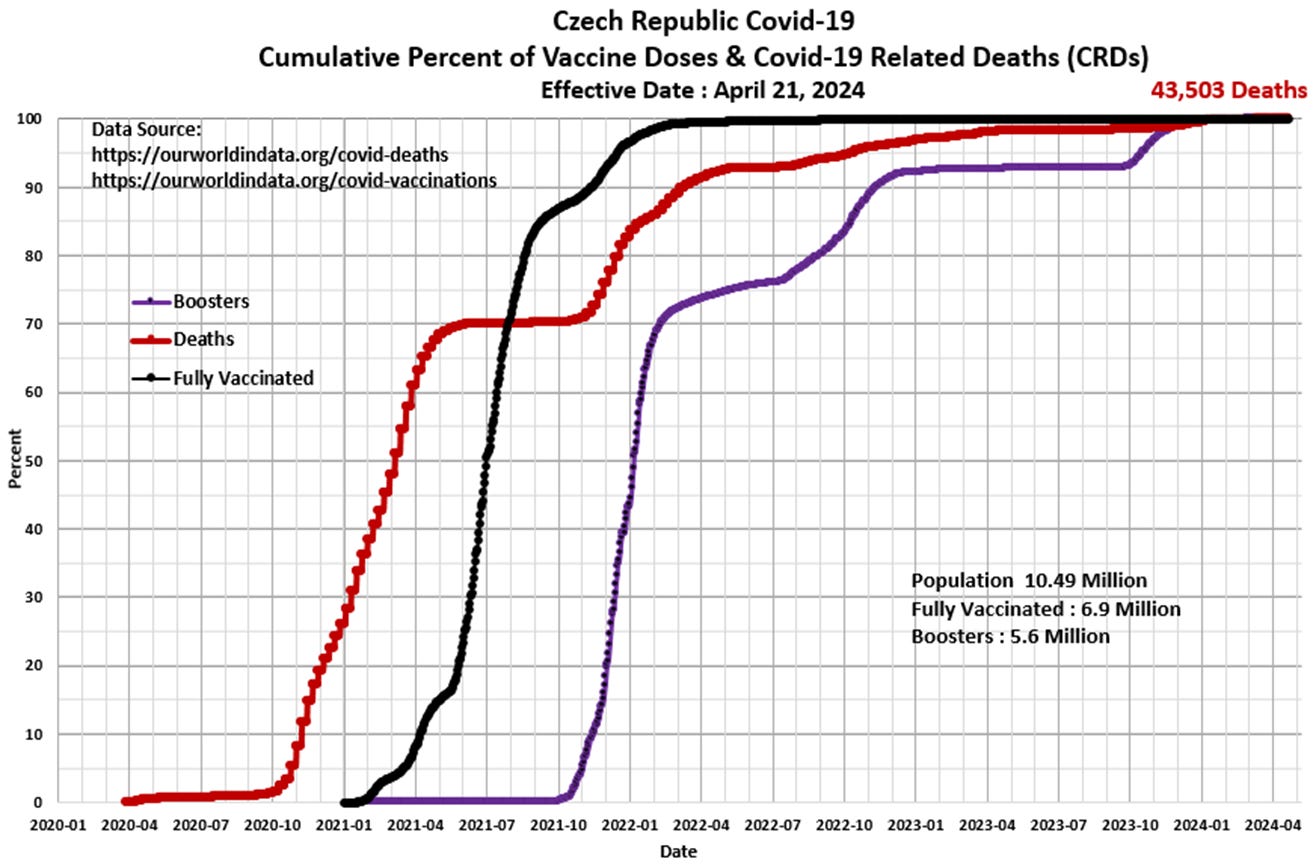
Panel 1 The first graph is a construct by the author as a standard CotD presentation which illustrates Covid-19 related deaths (CRDs) and vaccinations. The CRD rate was essentially zero from the outset of the SARs-CoV-2 pandemic in March 2020, however, the CRD took-off at a very high rate by October 2020 and continued into Q2’2021. The vaccination program began in January 2021 with accelerated injection rates into Q4’2021. The booster program was initiated in Q1’2021 with once again accelerated injection rates starting in October 2021 and continuing into Q1’2022. There appears to be a case for a vaccine-to-death correlation starting in Q4’2021 with 85 percent of the fully vaccinated doses completed (60 percent of the population) plus the start of the booster program. This correlation continues into 2024, however, there appears to be room for interpretation. Total CRDs to date represents 0.41 percent of the population.

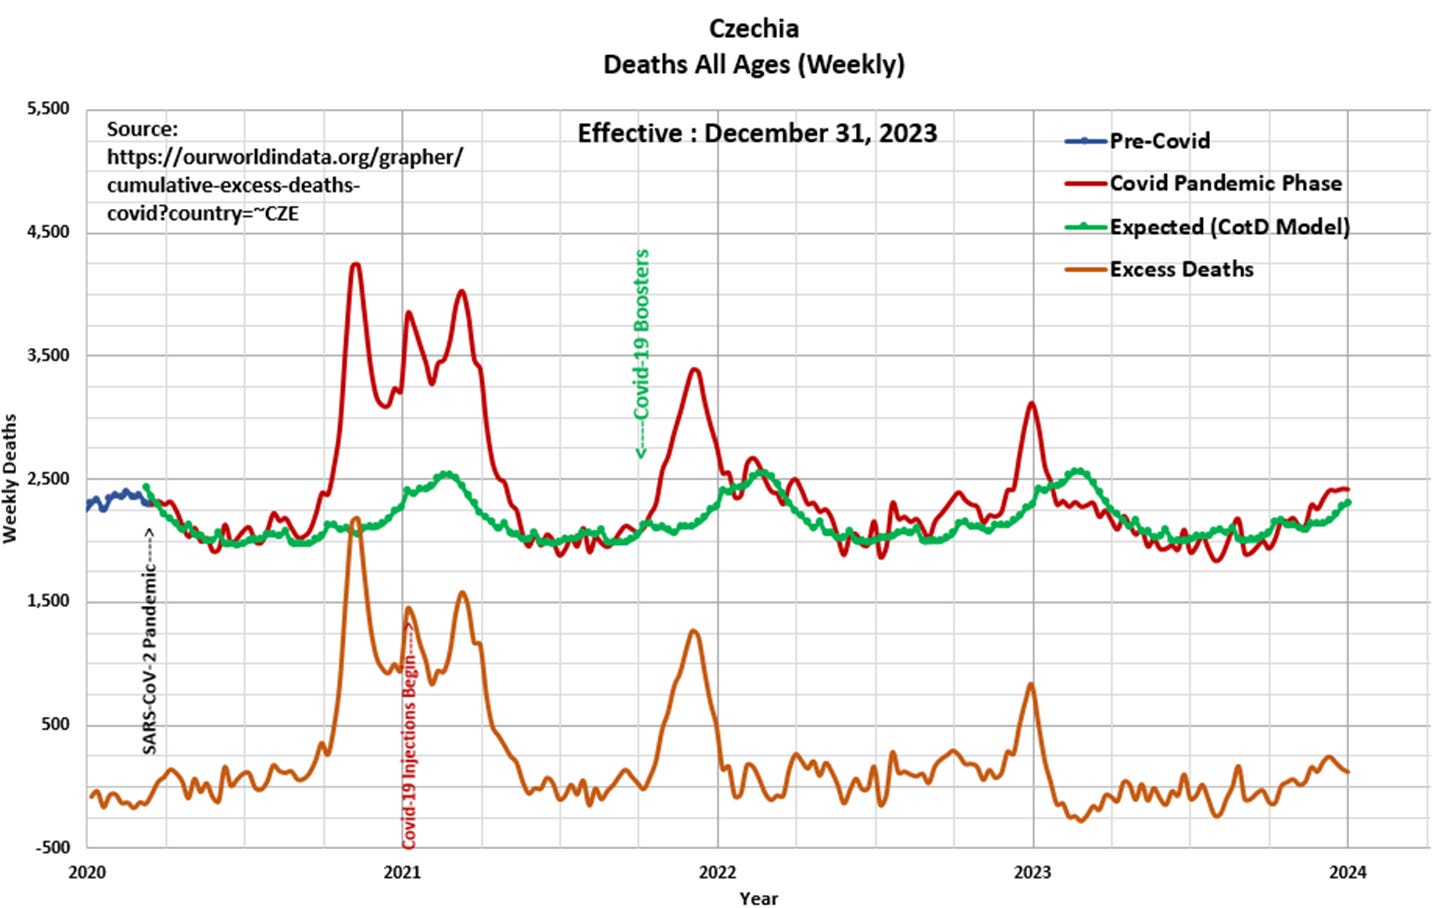
Panel 2 Observe the cyclical nature of deaths or all-cause mortality since 2015 for the Czech Republic (Czechia). The “Blue” line represents data prior to March 2020 and the “Red” line represents data since the SARS CoV-2 pandemic was initiated in March 2020. The “Green” line represents the “Expected” deaths (CotD Model) based on historical averages. The author has utilized the five year period January 2015 to December 2019 in order to calculate an average normalized curve for Weekly Deaths. The Expected (CotD Model) deaths incorporates an average 2.0 percent growth factor which appears to be a good match to the overall trend.

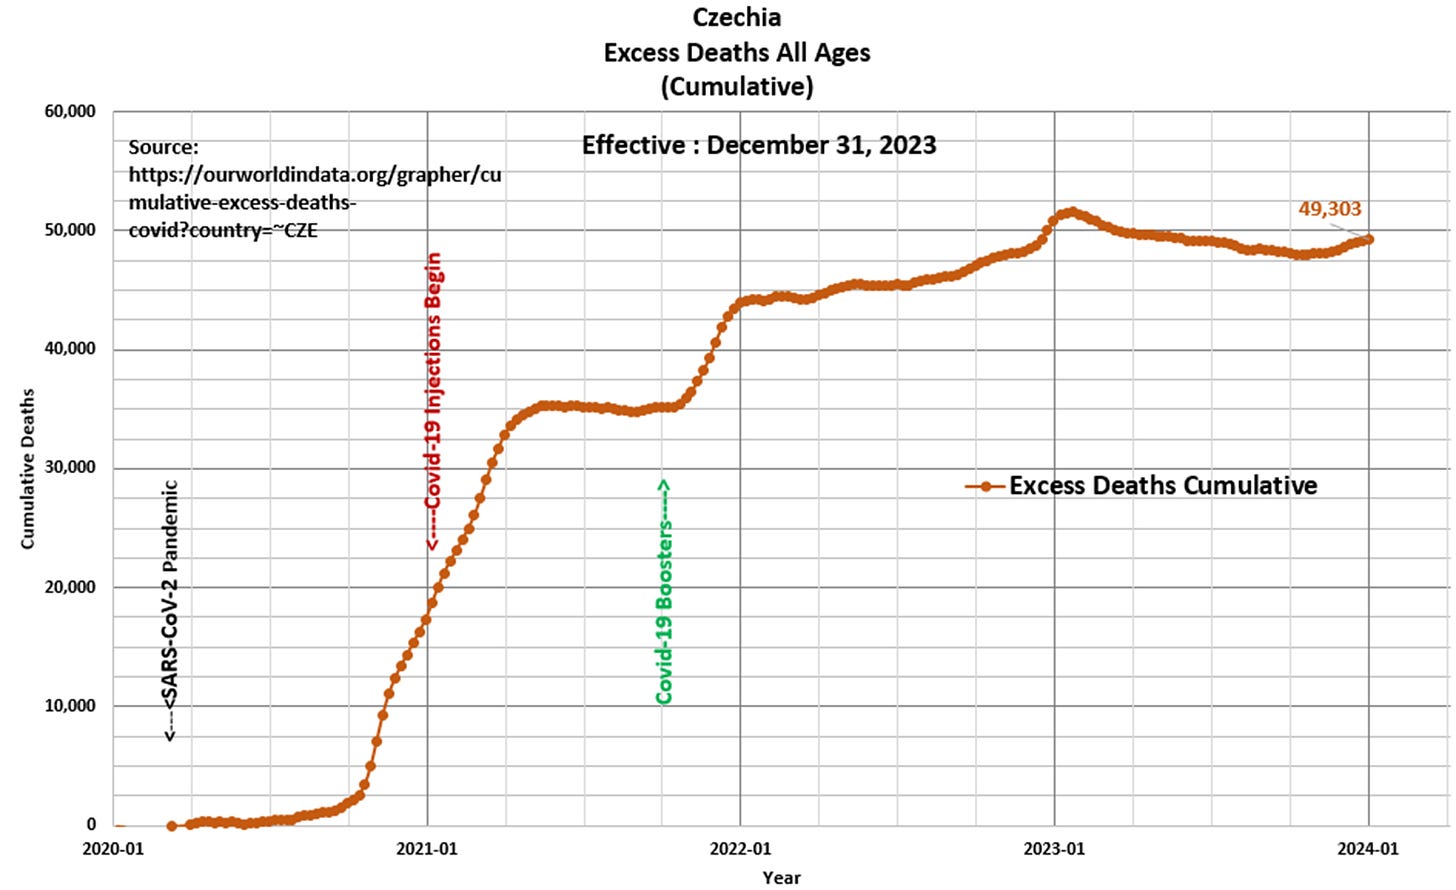
Panel 3 This presents the magnified portion (January 2020 to January 2024) of the graph in Panel 2. The “Orange” line represents “Excess Deaths” which is calculated by subtracting Expected Deaths from Official Deaths.

Panel 4 Based on the data and this author’s model 49,303 Excess Deaths have occurred since the start of the pandemic, of which 32,067 Excess Deaths (65 percent) have occurred since the start of Covid-19 injections in January 2021. This compares to 44,073 Excess Deaths since the start of the pandemic as per the ourworldindata.org website.

“In a healthy body dwells a healthy spirit” Czech Proverb


