by Eldric Vero
August 2, 2024
eldric.substack.com
The following articles are relevant to this CotD:
1) BBC News December 11, 2021 “Covid in Austria: Mass protest in Vienna against measures” (see link: https://www.bbc.co.uk/news/world-europe-59625302 ). As per the article: Police say about 44,000 people rallied in the capital, Vienna, the fourth straight weekend of demonstrations. The protesters are against the government’s decision to make Covid-19 jabs mandatory from February. Opponents say people should have the freedom to decide for themselves whether to be vaccinated. The government says nobody will be vaccinated by force, but those who refuse the jab will receive fines of up to €3,600 (£3.070; $4,000).
2) The Expose News December 17, 2023 “#PlasmidGate: Biotechnician raises plasmid DNA contamination in covid injections during Austrian TV talk show” (see link: https://expose-news.com/2023/12/17/plasmidgate-biotechnician-raises-plasmid-dna-contamination-in-covid-injections-during-austrian-tv-talk-show/ ). As per the article: “Before you ever say that you are calling on people to get vaccinated again, you should think carefully [and] look at what you have learned in the last few years. And you learned, for example, back in February, this year it was published for the first time that the vaccine was contaminated, namely with plasmid DNA,” Dr. Monika Henninger-Erber said during Talk on Hanger-7 on Thursday. “PlasmidGate … that’s not just any idea that someone has, but this is real data from laboratories, repeatedly shown that we are there have a huge problem,” she said.
The author of the CotD has combined analyses of Covid-19 and Excess Deaths (all causes) as these are related.
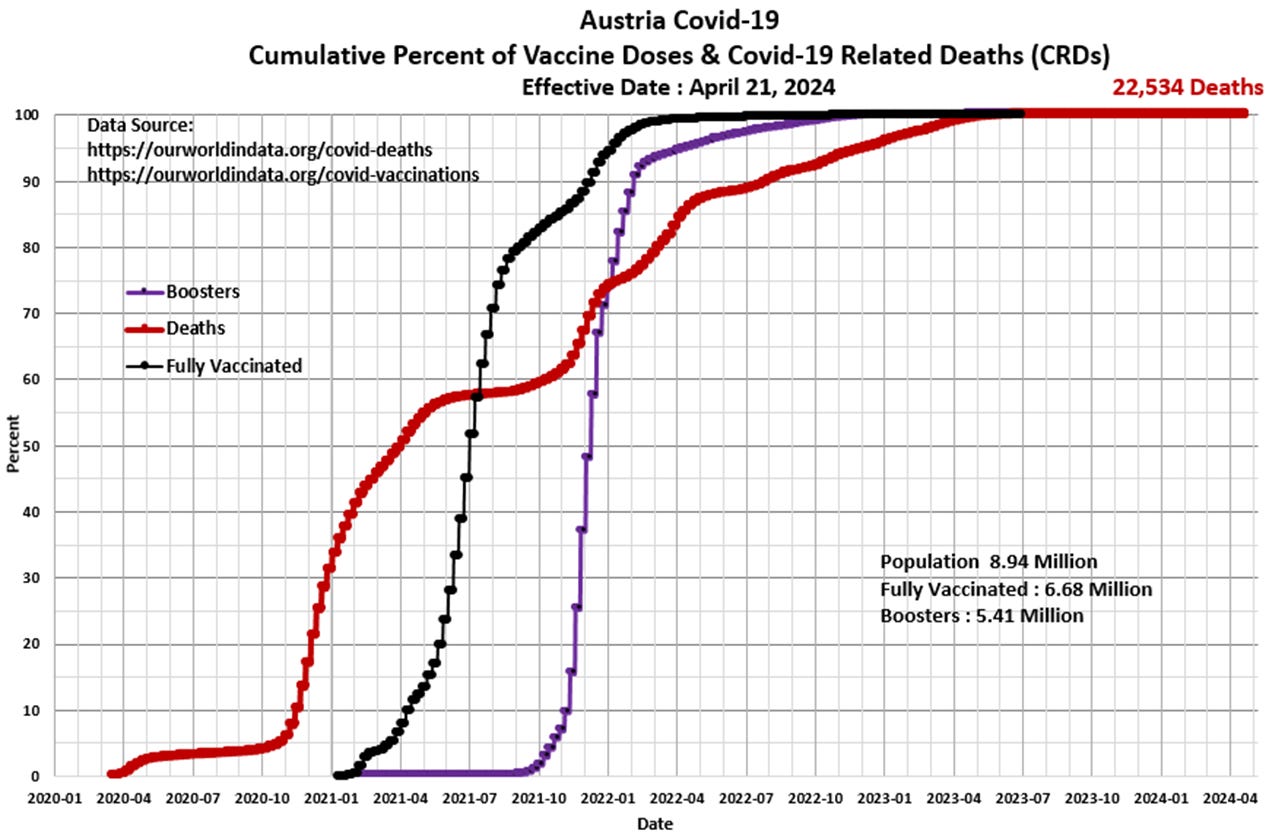
Panel 1 The first graph is a construct by the author as a standard CotD presentation which illustrates Covid-19 related deaths (CRDs) and vaccinations. The CRD rate was at a relatively low rate from the outset of the SARs-CoV-2 pandemic in March 2020, however, the CRD took-off by November 2020 and continued into Q2’2021. As is fairly typical, the CRD rate subsided somewhat into the summer of 2021, however, continued at a high rate into Q3’2022. The vaccination program began in January 2021 with very high injection rates into Q3’2021. The booster program was initiated in Q1’2021 with high injection rates starting in October 2021 and continuing into Q1’2022. The vaccine-to-death correlation appears to be noticeable starting in Q4’2021 based on mirror-like curves. The CRD rate has declined significantly since Q2’2023 as vaccination uptake has waned and is essentially zero. Total CRDs to date represents 0.25 percent of the population.
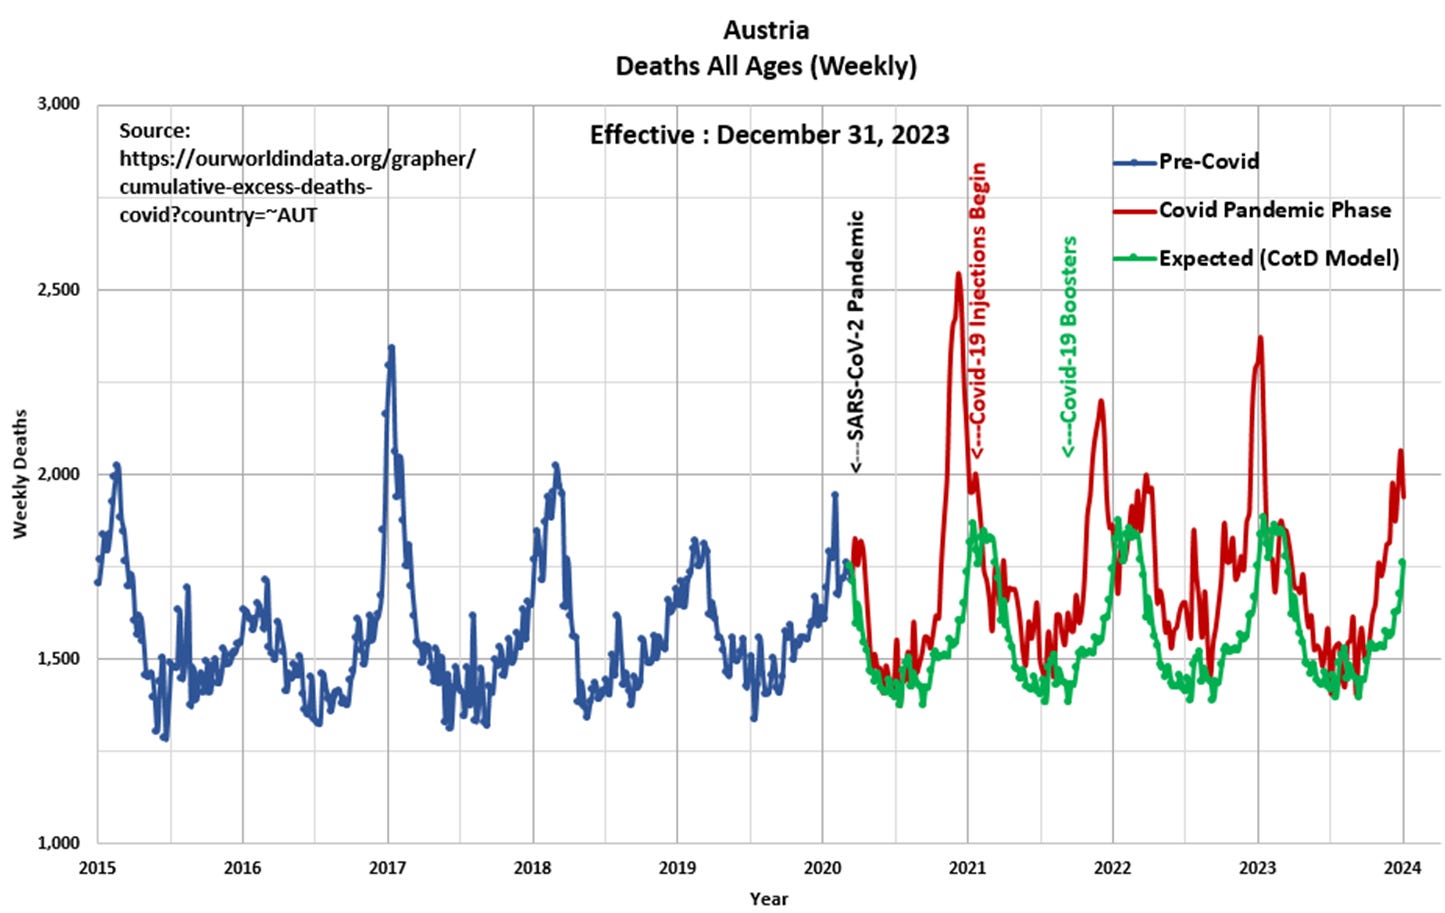
Panel 2 Observe the cyclical nature of deaths or all-cause mortality since 2015. The “Blue” line represents data prior to March 2020 and the “Red” line represents data since the SARS CoV-2 pandemic was initiated in March 2020. The “Green” line represents the “Expected” deaths (CotD Model) based on historical averages. The author has utilized the five year period January 2015 to December 2019 in order to calculate an average normalized curve for Weekly Deaths. The Expected (CotD Model) deaths incorporates an average 1.0 percent growth factor which appears to be a good match to the overall historical trend.
Panel 3 This presents the magnified portion (January 2020 to January 2024) of the graph in Panel 2. The “Orange” line represents “Excess Deaths” which is calculated by subtracting Expected Deaths from Official Deaths.
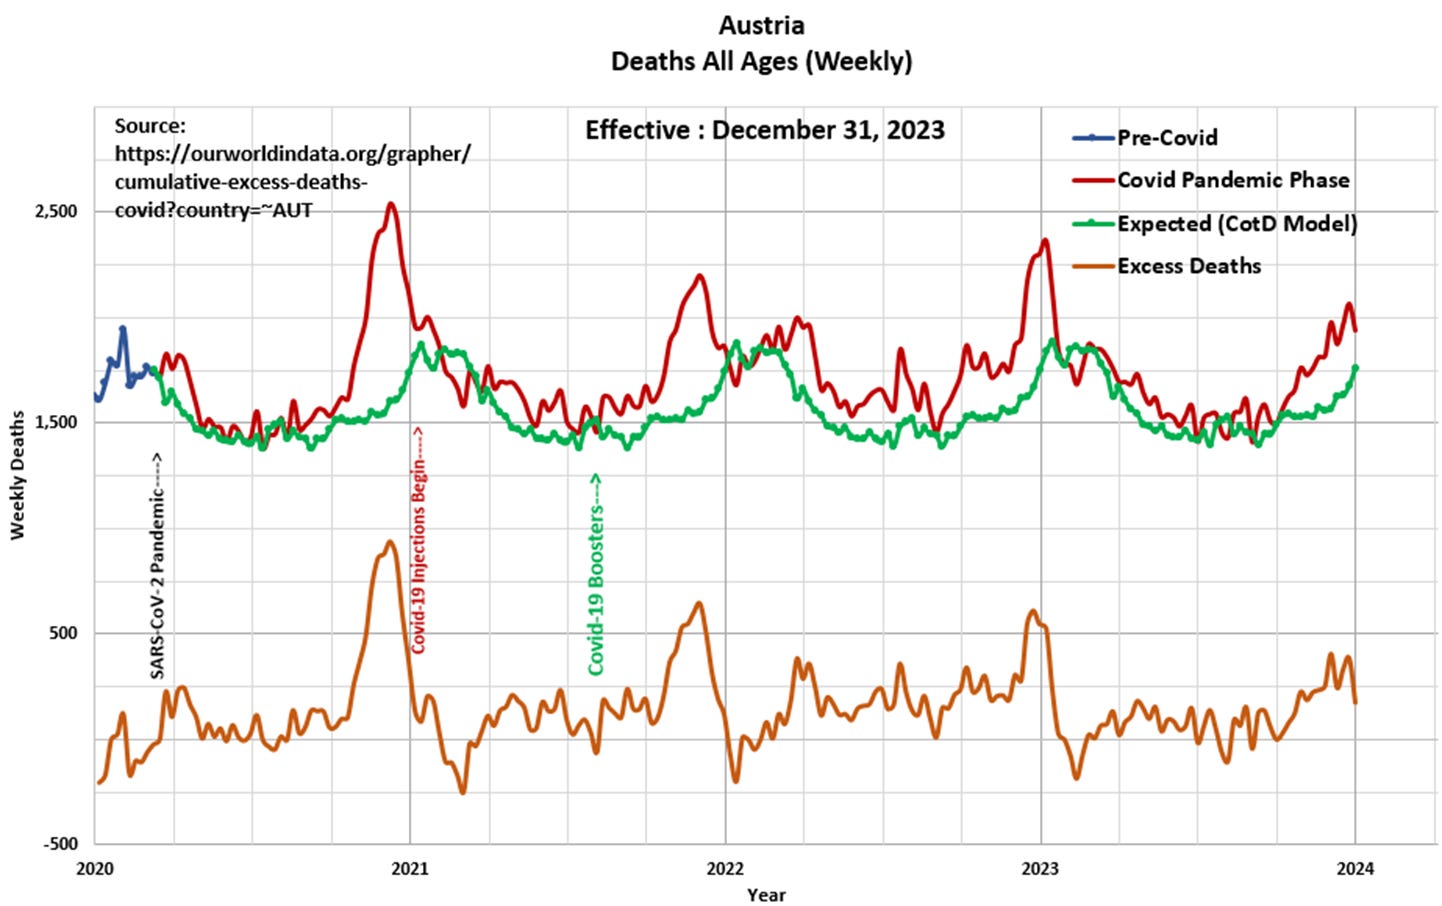
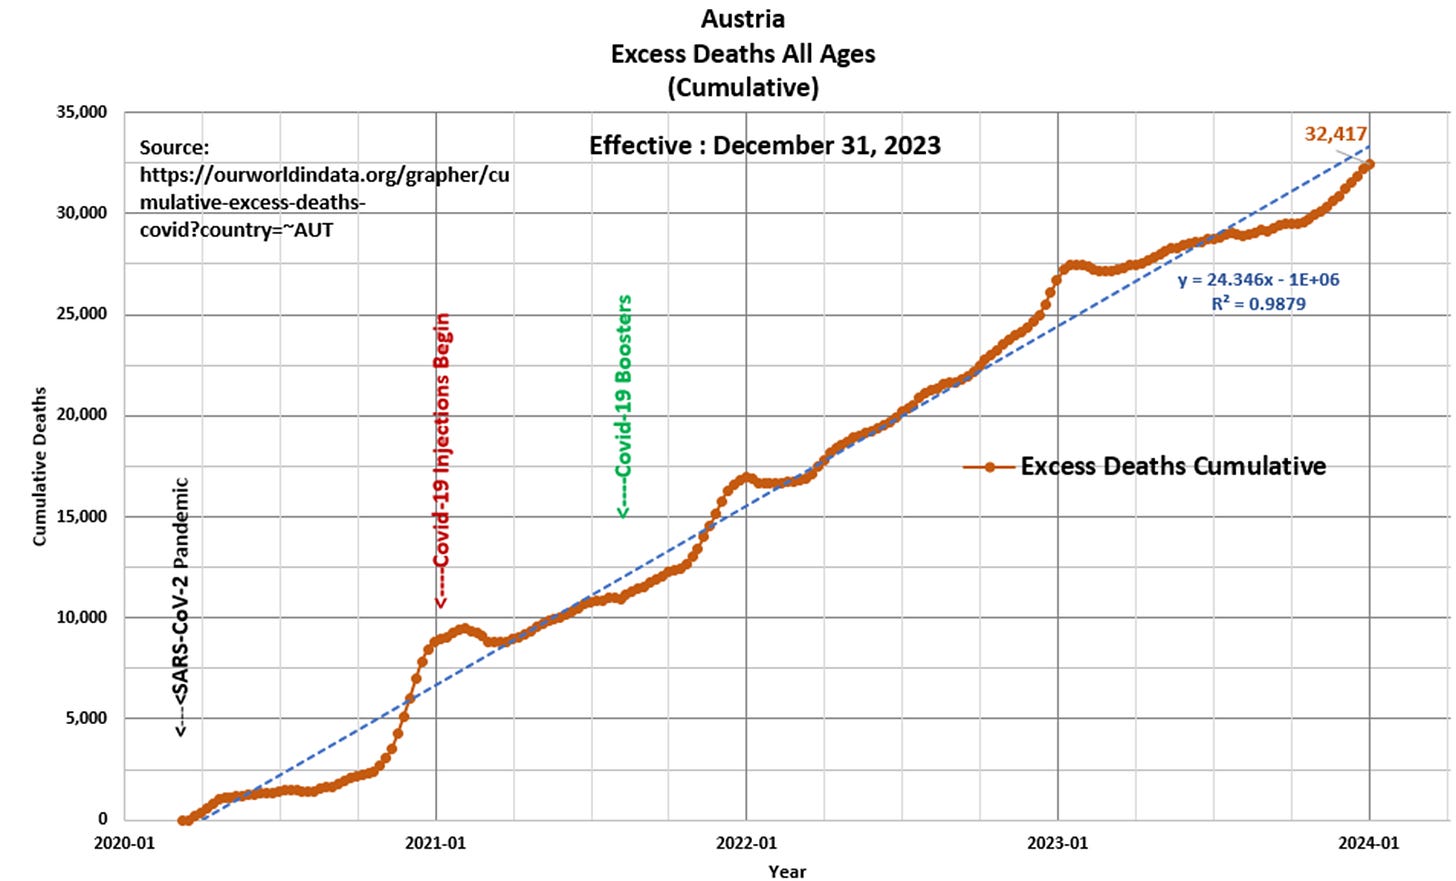
Panel 4 Based on the data and this author’s model 32,417 Excess Deaths have occurred since the start of the pandemic, of which 23,594 Excess Deaths (73 percent) have occurred since the start of Covid-19 injections in January 2021. This compares to 28,472 Excess Deaths since the start of the pandemic as per the ourworldindata.org website.
“There is no more dangerous menace to civilization than a government of incompetent, corrupt, or vile men” Ludwig von Mises


