by Eldric Vero
August 5, 2024
The following articles are relevant to this CotD:
1) Breaking Travel News March 22, 2022 “Hungary repeals all Covid-19 travel restrictions” (see link: https://www.breakingtravelnews.com/news/article/hungary-repeals-all-covid-19-travel-restrictions/ ). As per the article: Hungary has phased out almost all Covid-19 restrictions. Travellers can enter Hungary without the need for any vaccination or immunity certificate or any type of tests. At the same time, vaccination certificates are no longer required to access indoor congresses or conferences, accommodations and spas, or outdoor events of any type.
2) The Expose News July 18, 2024 “European Court of Justice says that Pfizer is liable for damage if its covid vaccine is defective” (see link: https://expose-news.com/2024/07/18/ecj-says-that-pfizer-is-liable-for-damage/ ). As per the article: On Wednesday, the European Court of Justice ruled that the European Commission was wrong to conceal details of its multi-billion euro deals for covid vaccines. The European Court of Justice referred to Directive 85/374 to rule that “a producer is liable for the damage caused by a defect in its product.” The definition of damage includes “damage caused by death or by personal injuries” (Article 9). The covid vaccines lack the safety that the public is entitled to expect. It would seem that according to the European Court of Justice’s ruling on Wednesday, Pfizer’s covid product is defective and Pfizer is liable for the deaths and injuries it has caused.
The author of the CotD has combined analyses of Covid-19 and Excess Deaths (all causes) as these are related.
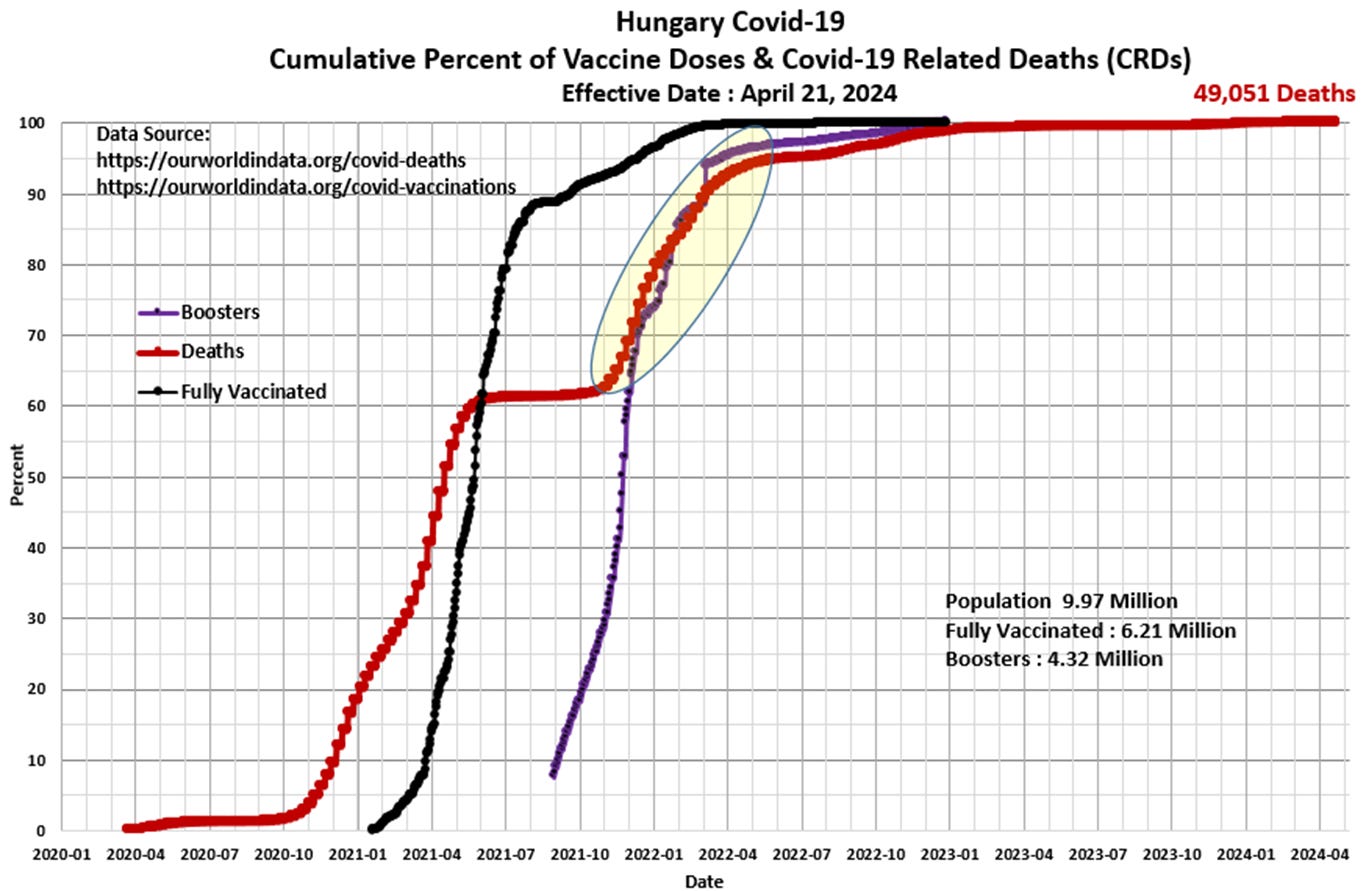
Panel 1 The first graph is a construct by the author as a standard CotD presentation which illustrates Covid-19 related deaths (CRDs) and vaccinations. The CRD rate was at a relatively low rate from the outset of the SARs-CoV-2 pandemic in March 2020, however, the CRD rate took-off by November 2020 and continued into Q2’2021. As is fairly typical, the CRD rate subsided (nearly flattened curve) into the summer of 2021, however, continued at a high rate into Q2’2022. The vaccination program began in January 2021 with very high injection rates into Q3’2021. The booster program was initiated in Q3’2021 with high injection rates continuing into Q2’2022. The booster-to-death correlation (yellow shaded) is near 100 percent starting in Q4’2021 as the curves essentially overlap. The CRD rate has declined significantly since Q4’2022 as vaccination uptake has waned and is essentially zero. Total CRDs to date represents 0.49 percent of the population.

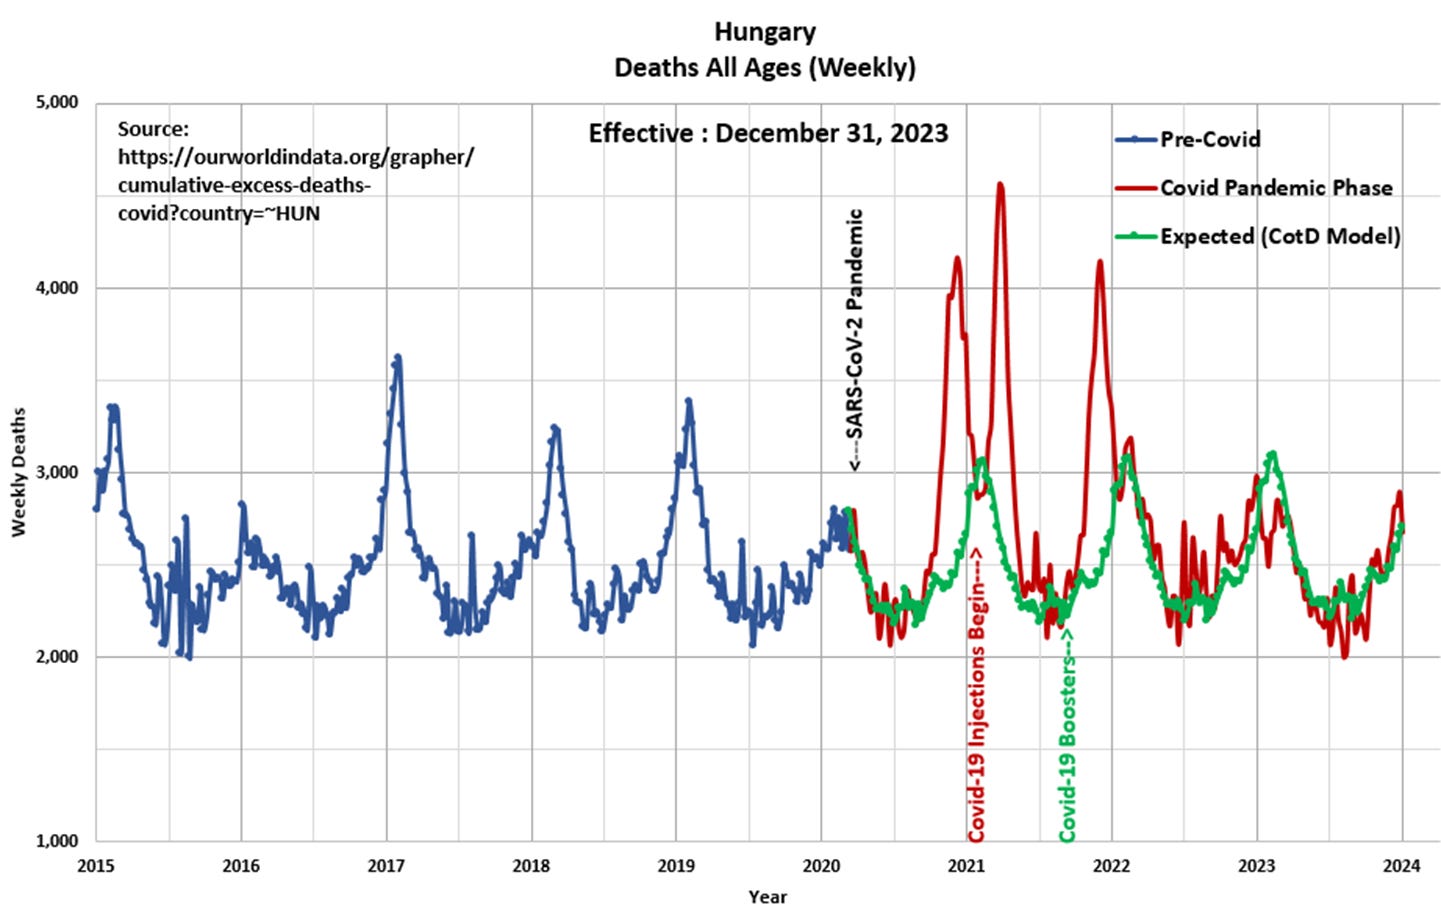
Panel 2 Observe the cyclical nature of deaths or all-cause mortality since 2015. The “Blue” line represents data prior to March 2020 and the “Red” line represents data since the SARS CoV-2 pandemic was initiated in March 2020. The “Green” line represents the “Expected” deaths (CotD Model) based on historical averages. The author has utilized the five year period January 2015 to December 2019 in order to calculate an average normalized curve for Weekly Deaths. The Expected (CotD Model) deaths incorporates an average 0.5 percent growth factor which appears to be a good match to the overall historical trend.

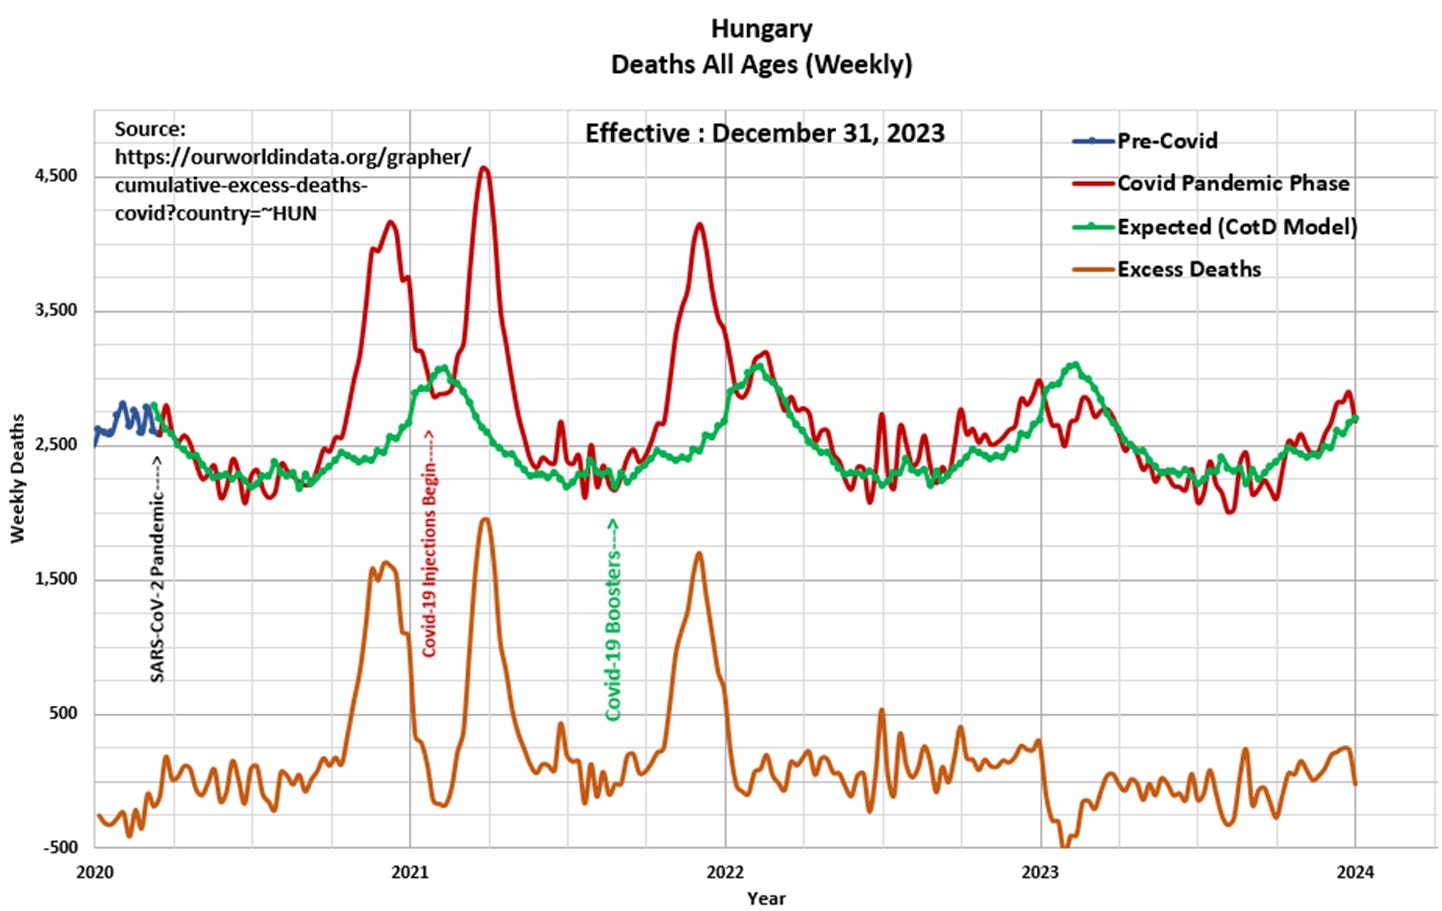
Panel 3 This presents the magnified portion (January 2020 to January 2024) of the graph in Panel 2. The “Orange” line represents “Excess Deaths” which is calculated by subtracting Expected Deaths from Official Deaths. Note the large spike in Excess Deaths after the injections were initiated.

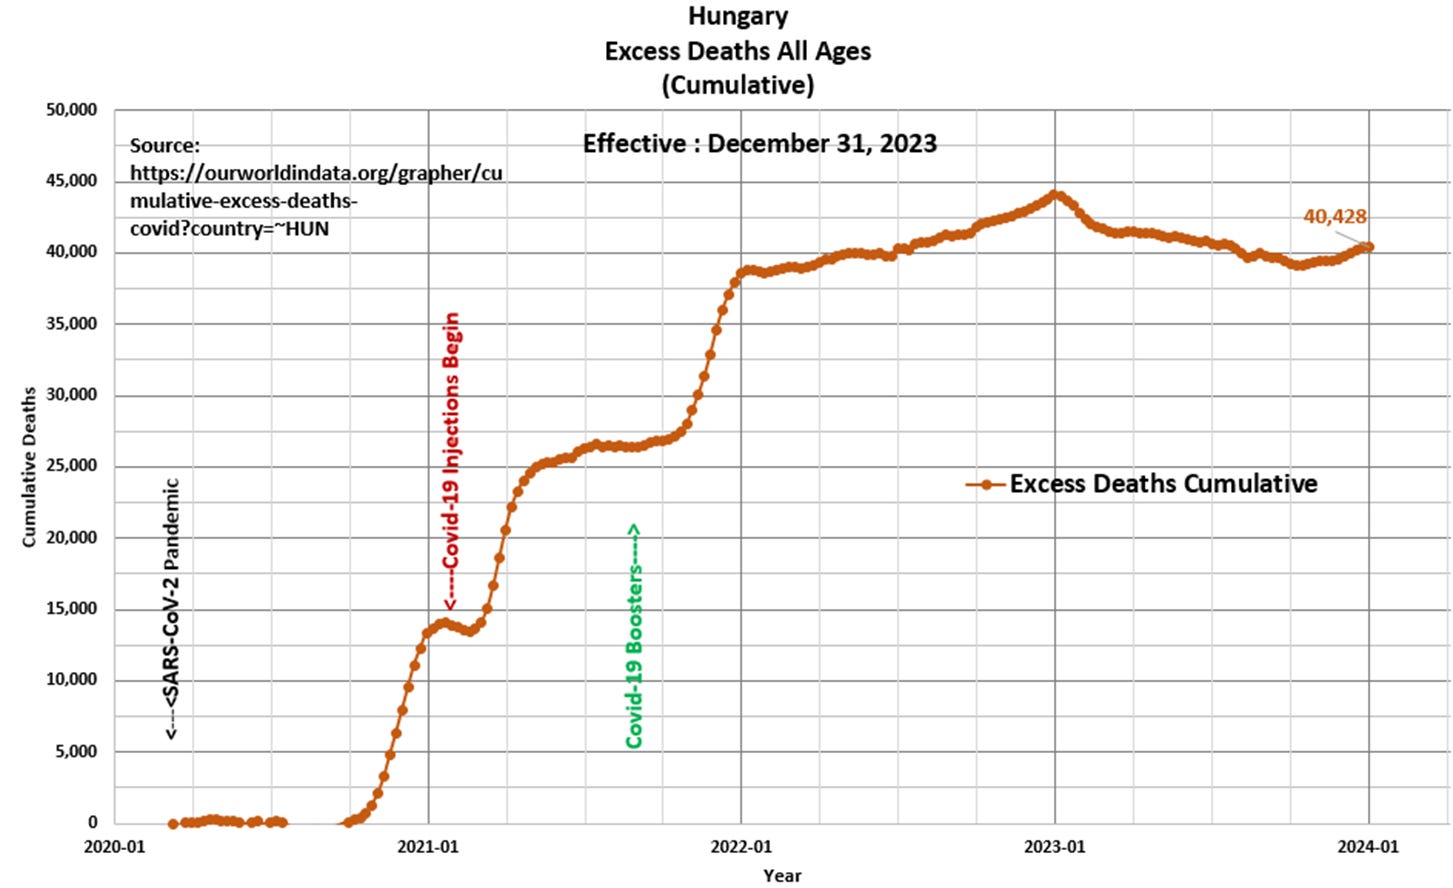
Panel 4 Based on the data and this author’s model 40,428 Excess Deaths have occurred since the start of the pandemic, of which 26,372 Excess Deaths (65 percent) have occurred since the start of Covid-19 injections in January 2021. This compares to 40,240 Excess Deaths since the start of the pandemic as per the ourworldindata.org website.

“Simplicity is the ultimate sophistication” Leonardo da Vinci


