by Eldric Vero
August 18, 2024
The following articles are relevant to this CotD:
1) Wikipedia as of August 18,2024 “COVID-19 pandemic in Poland” (see link: https://en.wikipedia.org/wiki/COVID-19_pandemic_in_Poland ). As per Wikipedia: On 10–12 March 2020 lockdown-type control measures were implemented, closing schools and university classes, offices, and cancelling mass events, and were strengthened on 25 March, limiting non-family gatherings to two people and religious gatherings to six and forbidding non-essential travel. Lockdown restrictions were tightened on 31 March 2020 by a government regulation, requiring individuals walking in streets to be separated by two metres, closing parks, boulevards, beaches, hairdressers and beauty salons, and forbidding unaccompanied minors from exiting their homes. On 9 April 2020 Prime Minister Mateusz Morawiecki announced a new control measure, in that from 16 April 2020 it was obligatory to cover one’s nose and mouth in public places. After being asked where people could obtain masks from, Minister of Health Szumowski clarified that any form of face covering, such as scarves, would be acceptable.
2) The Expose News December 7,2021 “Poland’s Nuremberg 2.0 Project Has Been Launched” (see link: https://expose-news.com/2021/12/07/polands-nuremberg-2-0-project-has-been-launched/ ). As per the article: The Nuremberg 2.0 Project is a civic initiative with the aim of collecting historical and legal documentation describing acts of crimes, lawlessness, abuses and omissions of the public authority and to document individual tragedies unknown to the wider public today. Dr. Fuellmich explained…”The virus is no more dangerous than the common flu. If you look at the damage that results from these measures then you know what this is about. Because what we have learned from all the people we have listened to, including of course the psychiatrists and psychologists, it looks as though this damage is not accidental but intentional”.
The author of the CotD has combined analyses of Covid-19 and Excess Deaths (all causes) as these are related.
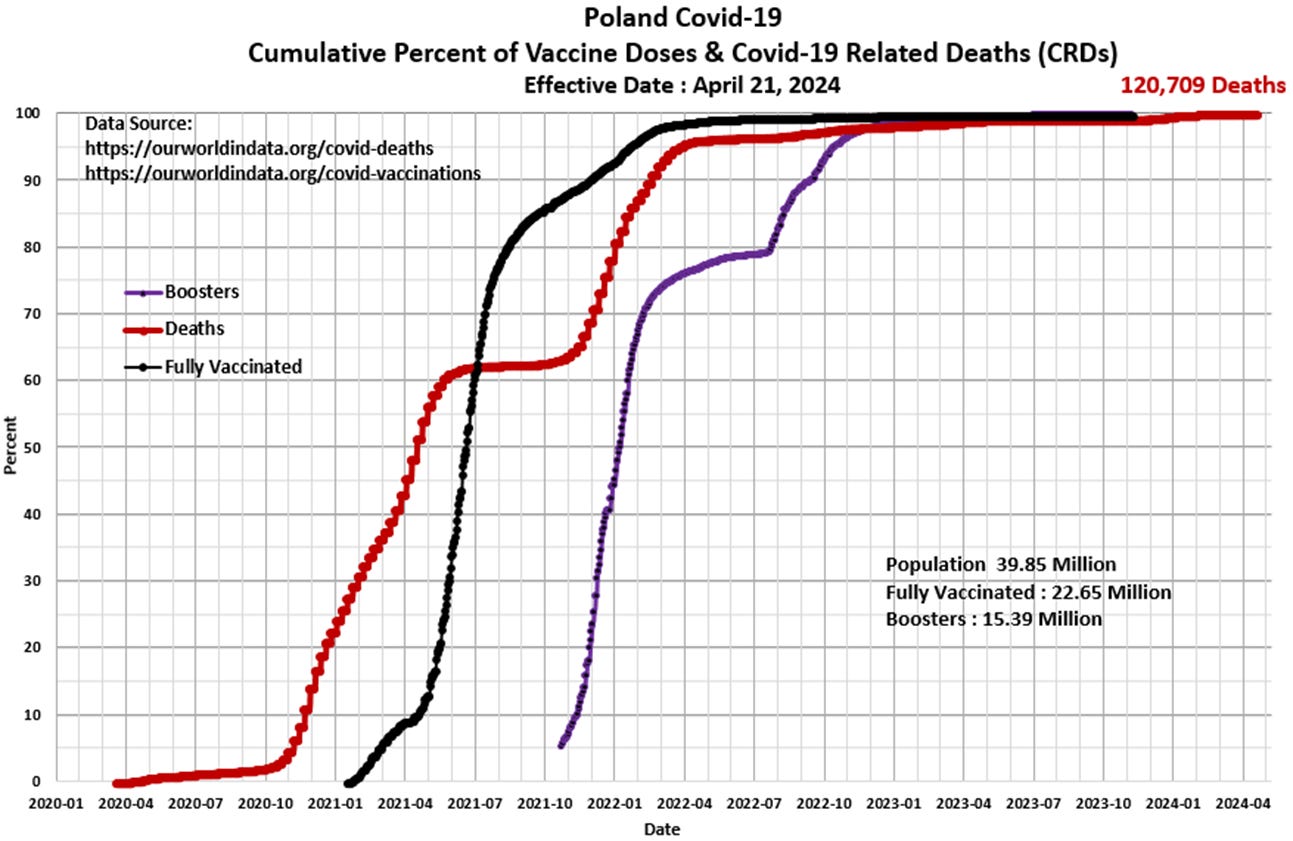
Panel 1 The first graph is a construct by the author as a standard CotD presentation which illustrates Covid-19 related deaths (CRDs) and vaccinations. The CRD rate was at a relatively low rate from the outset of the SARs-CoV-2 pandemic in March 2020, however, the CRD rate took-off by November 2020 and continued at astonishing rates into Q2’2021. As is fairly typical, the CRD rate subsided (nearly flattened curve) into the summer of 2021, however, continued at a high rate into Q2’2022. The vaccination program was initiated in January 2021 with very high injection uptake rates into Q4’2021, however, there was relatively minor impact on the CRD rate curve. The booster program was initiated in October 2021 with again, high injection rates into Q4’2022. The vaccine-to-death correlation appears to be self-evident starting in November 2021, just a few weeks after the booster injections were initiated. The CRD rate waned significantly in 2023 and is essentially zero as the vaccination uptake approached near zero in Q4’2023. Total CRDs to date represent 0.30 percent of the population.

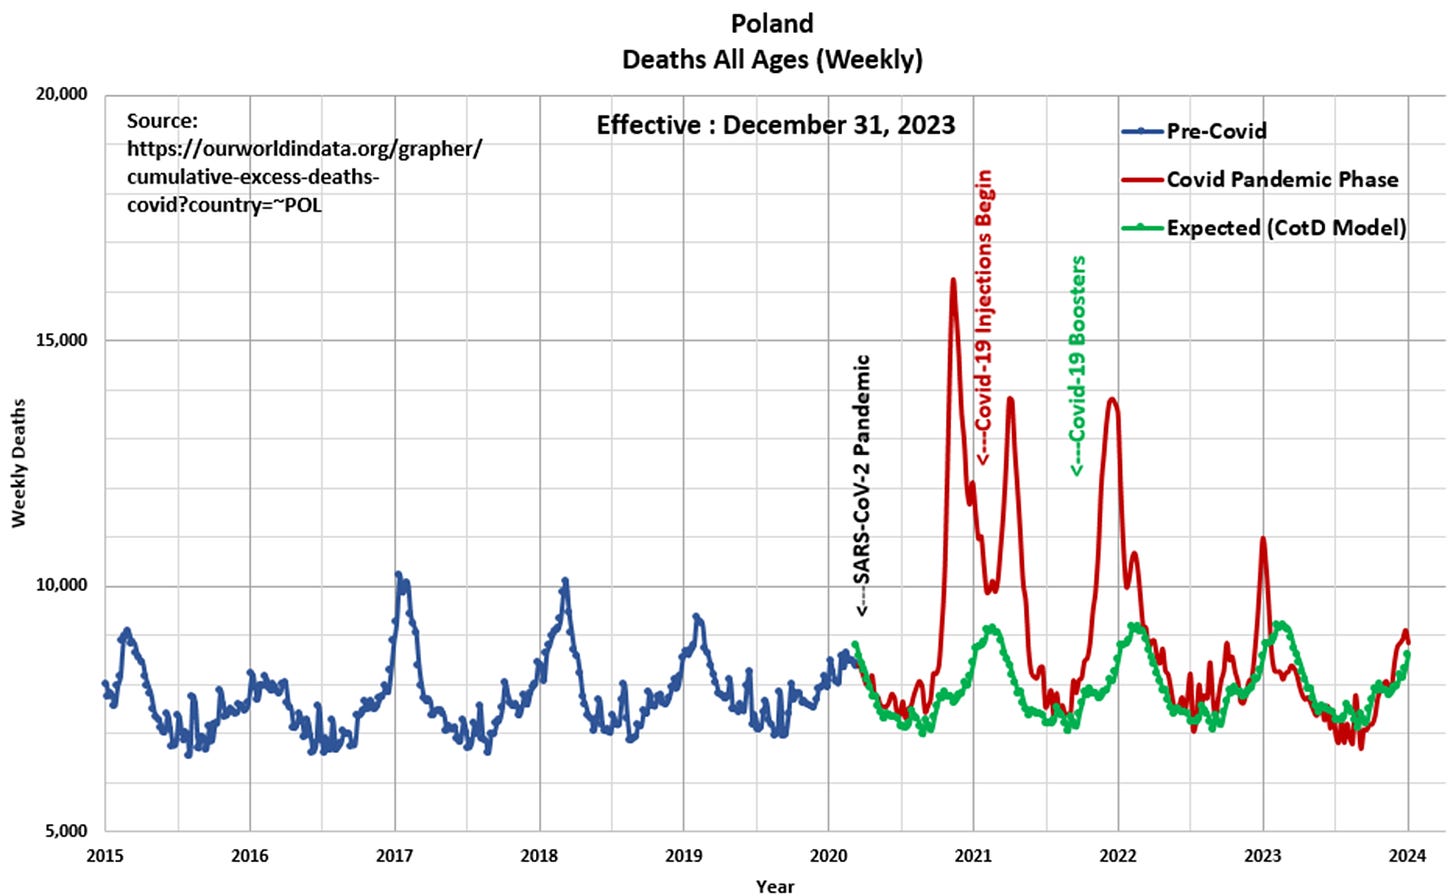
Panel 2 Observe the cyclical nature of deaths or all-cause mortality since 2015. The “Blue” line represents data prior to March 2020 and the “Red” line represents data since the SARS CoV-2 pandemic was initiated in March 2020. The “Green” line represents the “Expected” deaths (CotD Model) based on historical averages. The author has utilized the five year period January 2015 to December 2019 in order to calculate an average normalized curve for Weekly Deaths. The Expected (CotD Model) deaths incorporates an average 3.5 percent annual growth factor which appears to be a good match to the overall historical trend.

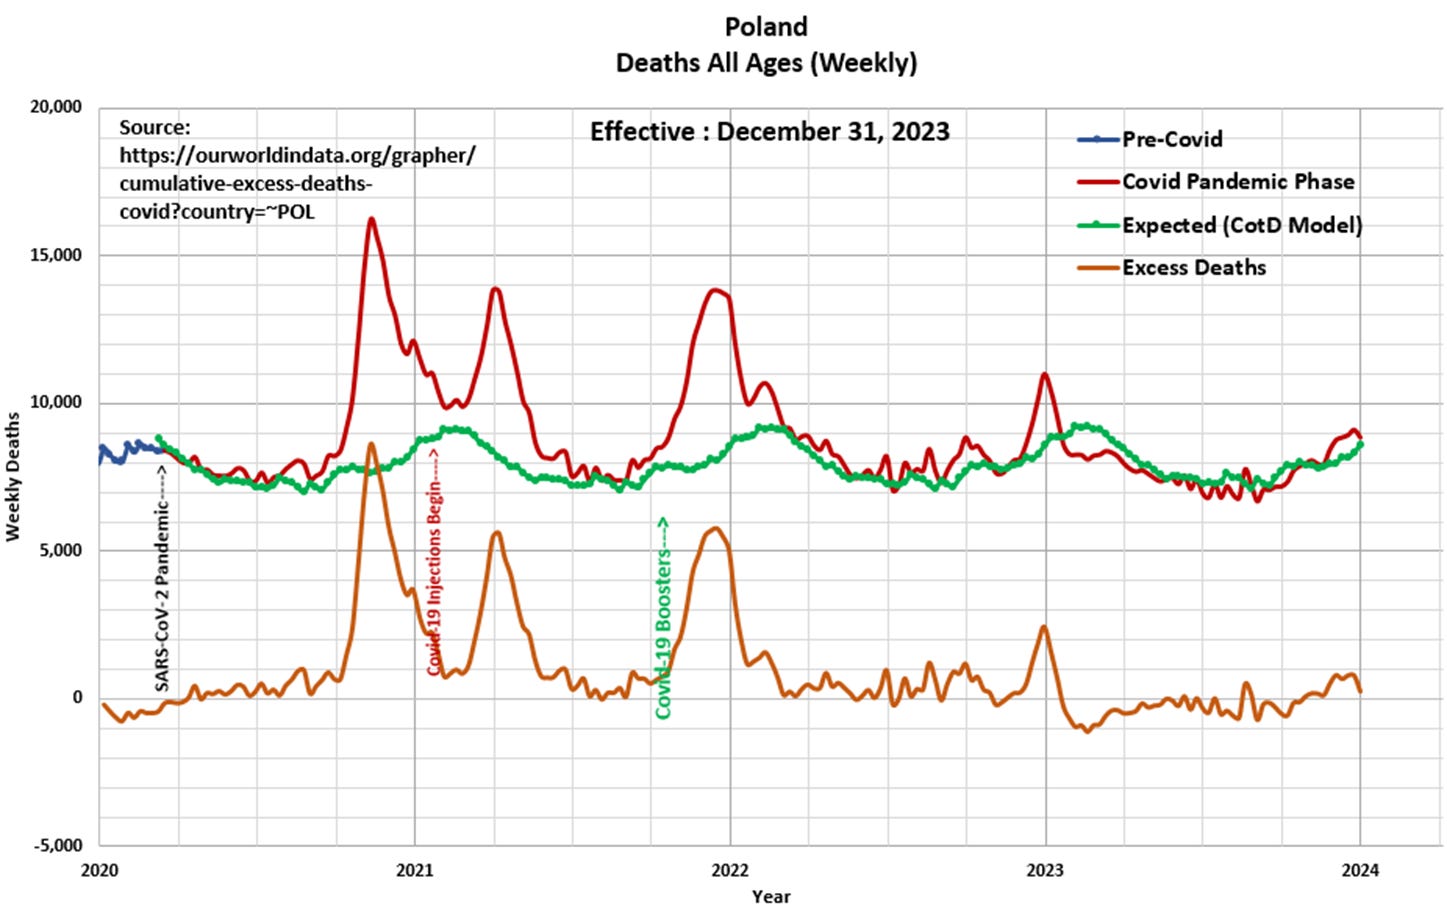
Panel 3 This presents the magnified portion (January 2020 to January 2024) of the graph in Panel 2. The “Orange” line represents “Excess Deaths” which is calculated by subtracting Expected Deaths from Official Deaths. Note the large spike in Deaths shortly after the vaccine injections.

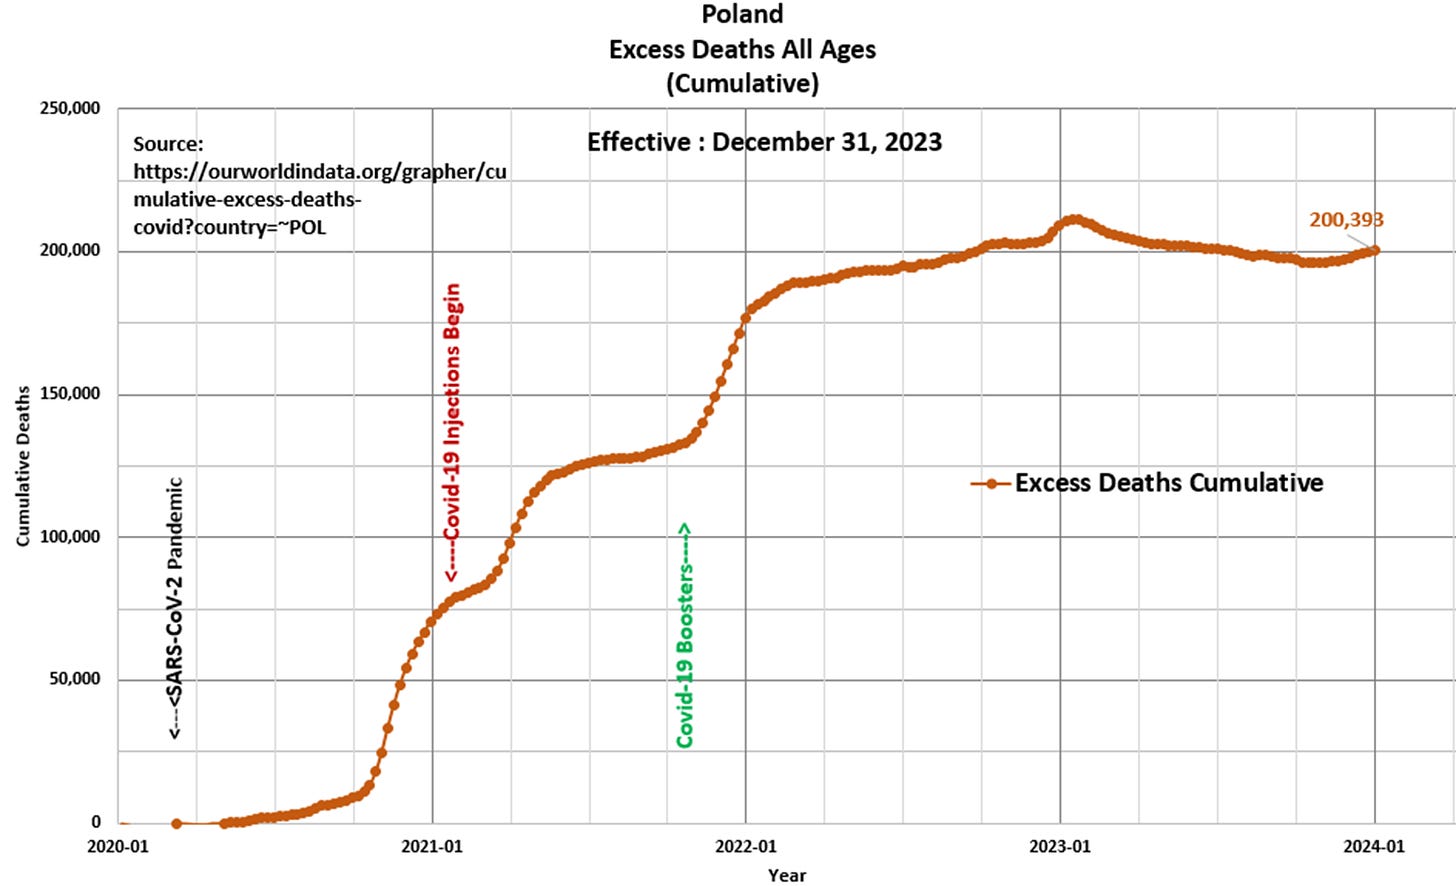
Panel 4 Based on the data and this author’s model 200,393 Excess Deaths have occurred since the start of the pandemic, of which 125,069 Excess Deaths (62 percent) have occurred since the start of Covid-19 injections in January 2021. This compares to 155,956 Excess Deaths since the start of the pandemic as per the ourworldindata.org website.

“You must never be fearful about what you are doing when it is right” Maria Salomea Sklodowska-Curie
Support Eldric Vero Substack


