by Eldric Vero
August 26, 2024
The following articles are relevant to this CotD:
1) BBC News October 5, 2021 “Guatemala: Anti-vaccine villagers attack and hold nurses with Covid jabs” (see link: https://www.bbc.co.uk/news/world-latin-america-58801096 ). As per the article: Local media report that residents rejected the vaccine because a villager who received a dose had developed side effects, which were interpreted as being health problems linked to the jab. Gabriel Sandova, the director of the provincial health department, told the Associated Press “This was bound to happen… A lot of people don’t believe in the illness”.
2) LaHora.gt News July 26, 2024 “This is what an epidemiologist recommends in light of the new variants of Covid-19” (see link: https://lahora.gt/nacionales/dguzman/2024/07/26/esto-recomienda-epidemiologo-ante-las-nuevas-variantes-del-covid-19/ ). As per the article: On July 24, the Ministry of Public Health and Social Assistance (MSPAS) shared the report on the Covid-19 variants that have been detected in Guatemala since last June. Erwin Calgua, an epidemiologist at San Juan de Dios General Hospital said that in the case of suffering from the new variants of Covid-19, the treatment remains the same as during the pandemic: acetaminophen, hydration and plenty of rest for the days that the treating physician deems necessary.
The author of the CotD has combined analyses of Covid-19 and Excess Deaths (all causes) as these are related.
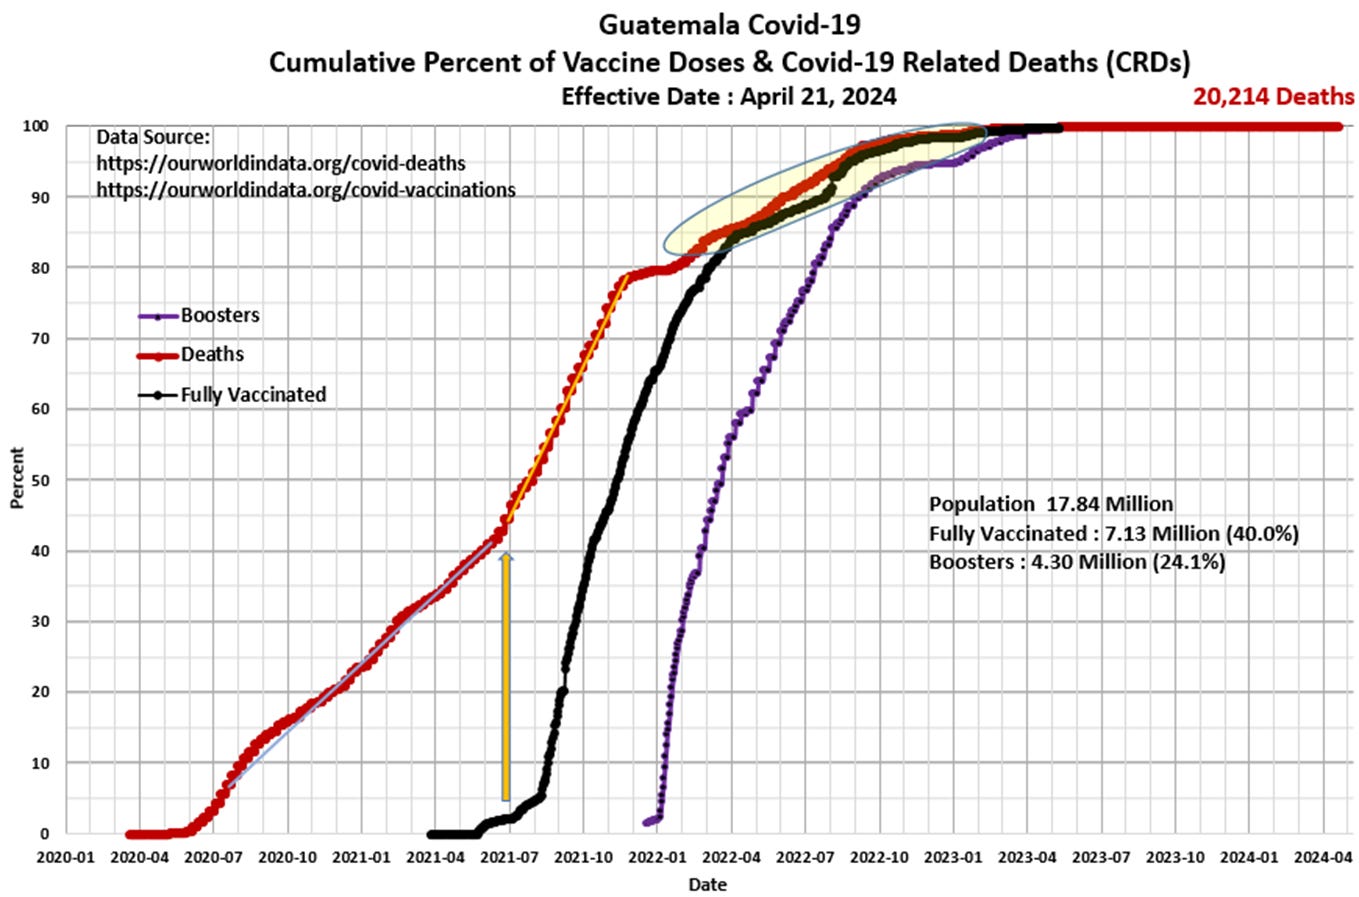
Panel 1 The first graph is a construct by the author as a standard CotD presentation which illustrates Covid-19 related deaths (CRDs) and vaccinations. The vaccination program began in March 2021 with no positive effect on reducing the CRD rate. Three to four months into the injection program, the CRD rate essentially doubled over the five month period July to November 2021. The CRD rate subsided temporarily in December 2021 and January 2022, however, increased again in Q1’2022, shortly after the booster injections began. The vaccine-to-death correlation appears to be self-evident as the curves are near 100 percent mirror images. The CRD rate peaked at 462 Guatemalan citizens dying during one week in September 2021 (66 deaths per day), which was absolutely tragic to say the least. The CRD rate has subsided significantly and is essentially zero since Q2’2023 as injection uptake has basically ended.
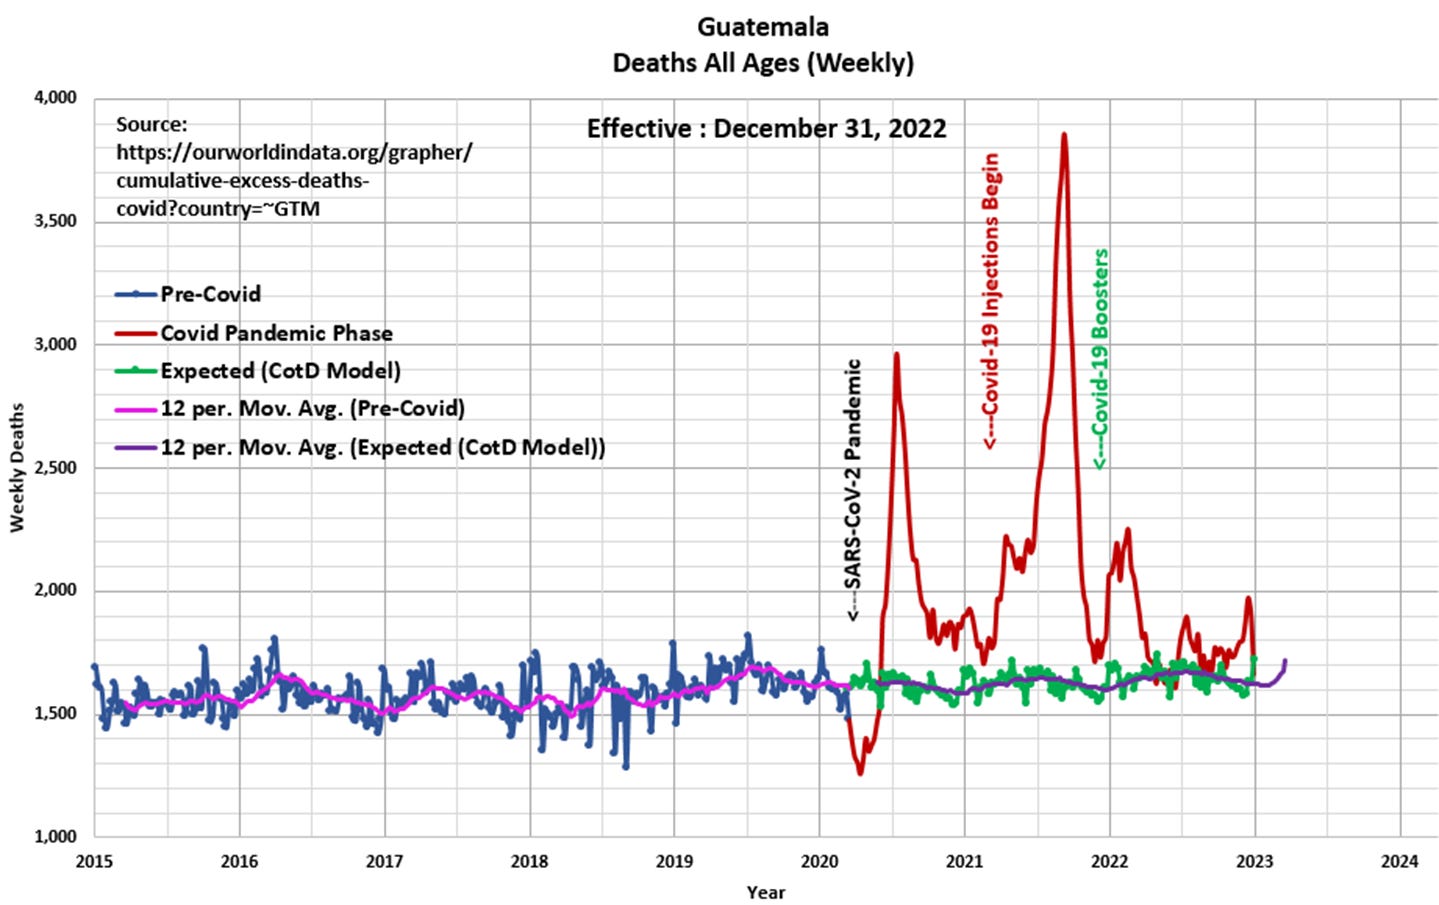
Panel 2 Observe the relatively noisy cyclical nature of deaths or all-cause mortality since 2015. The “Blue” line represents data prior to March 2020 and the “Red” line represents data since the SARS CoV-2 pandemic was initiated in March 2020. The “Green” line represents the “Expected” deaths (CotD Model) based on historical averages. The author has utilized the five year period January 2015 to December 2019 in order to calculate an average normalized curve for Weekly Deaths. The Expected (CotD Model) deaths incorporates an average 4.5 percent growth factor which appears to be a good match to the overall trend. The CotD author has included 12-month moving average trend-lines for analysis purposes.
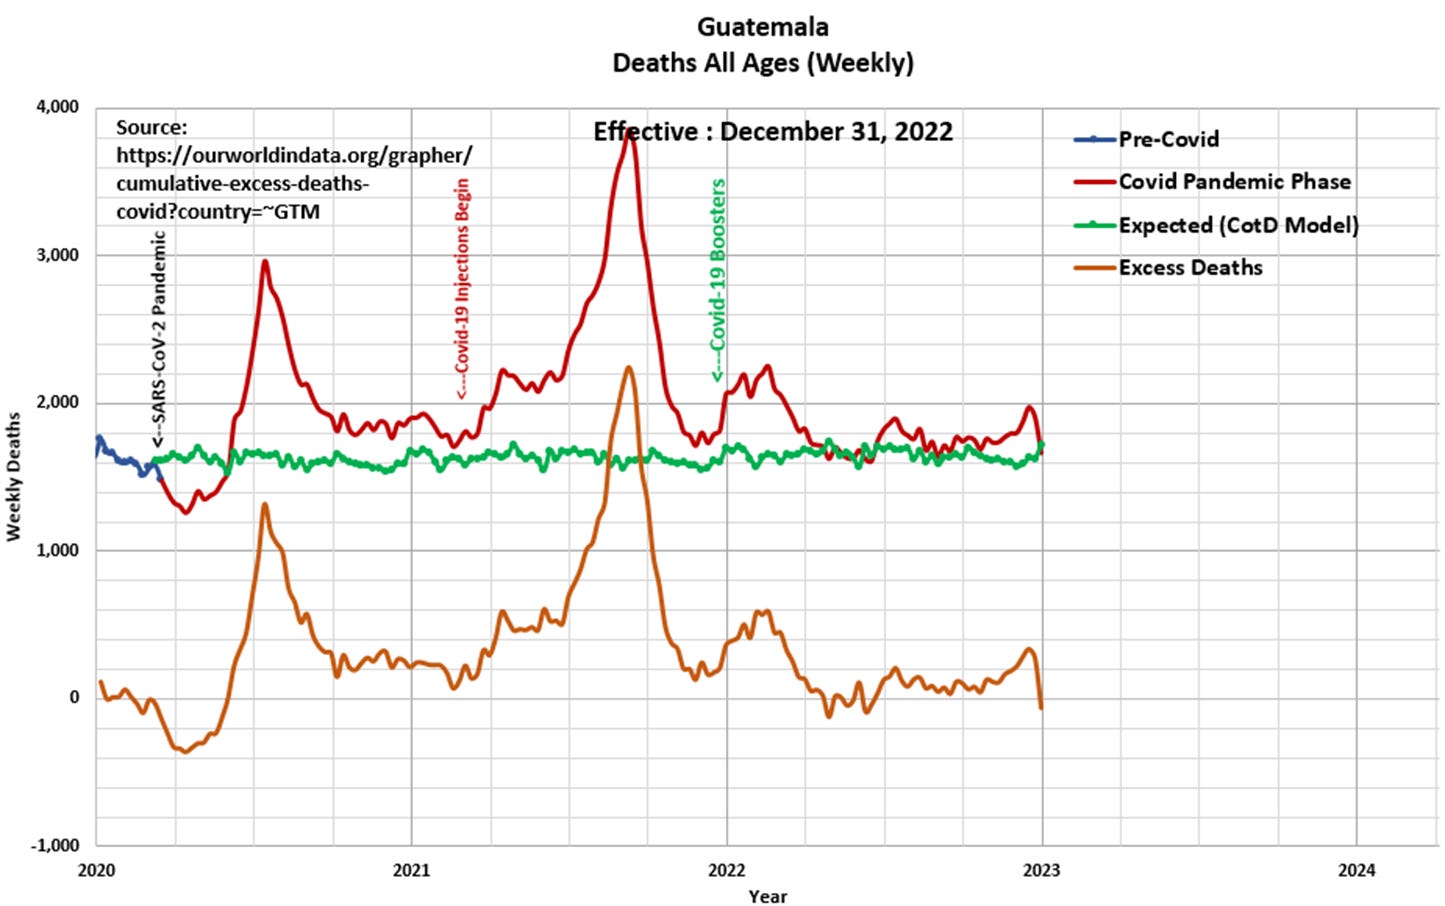
Panel 3 This presents the magnified portion (January 2020 to April 2023) of the graph in Panel 2. The “Orange” line represents “Excess Deaths” which is calculated by subtracting Expected Deaths from Official Deaths. Note the huge spike in deaths (115 percent above previous historical spikes) in September 2021, about six months after the injections were initiated.
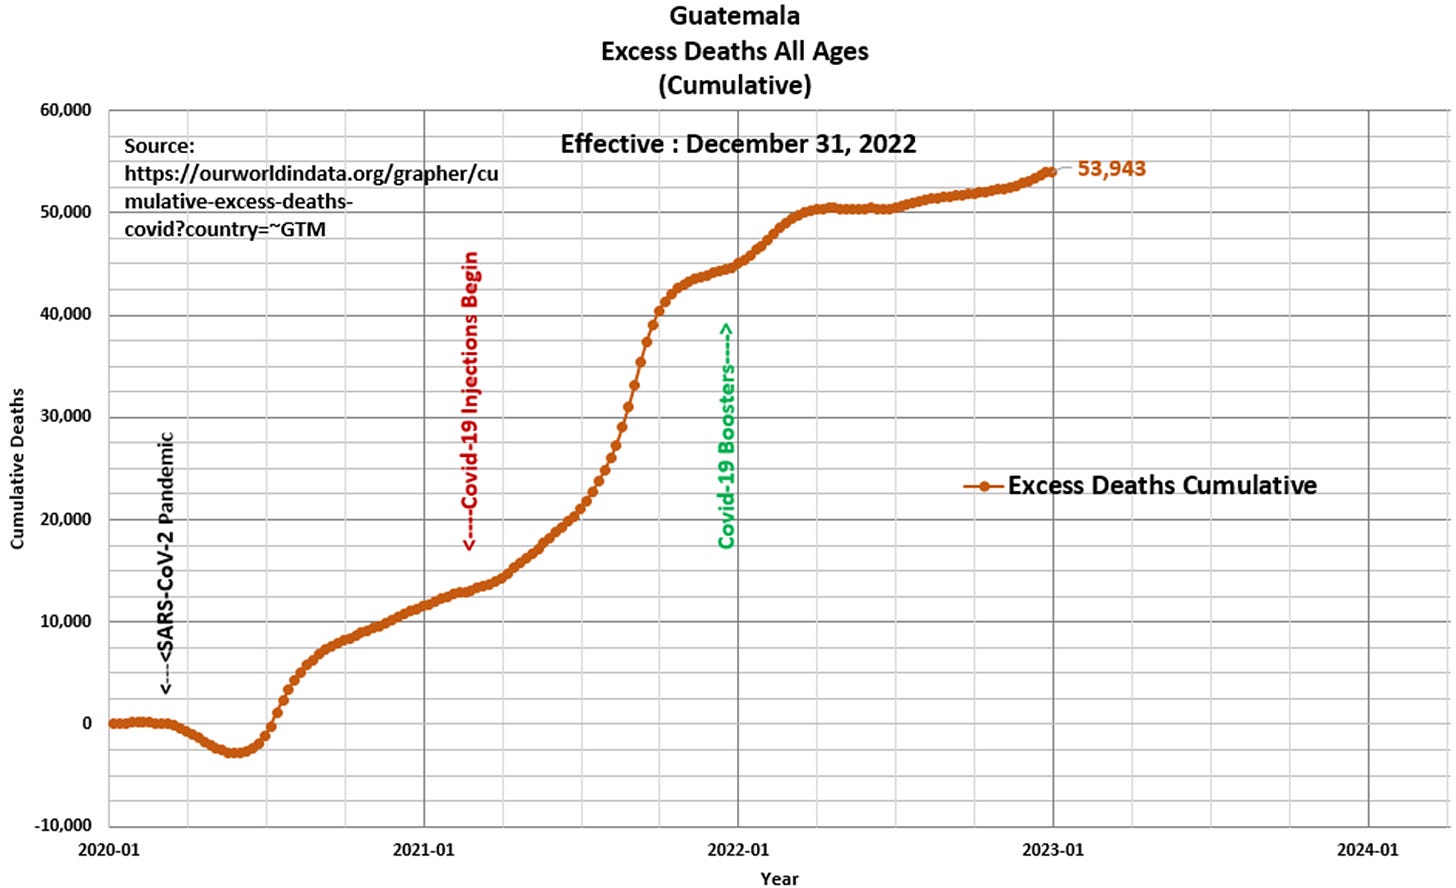
Panel 4 Based on the data and this author’s model 53,943 Excess Deaths have occurred since the start of the pandemic, of which 40,991 Excess Deaths (76 percent) have occurred since the start of Covid-19 injections in February 2021. This compares to 52,358 Excess Deaths since the start of the pandemic as per the ourworldindata.org website.
“Do not bear ill will toward those who tell you the truth.” Guatemalan Proverb


