by Eldric Vero
September 5, 2024
The following articles are relevant to this CotD:
1) Super Sally’s Newsletter September 2, 2024 “ABS has released Australia’s Jan-May 2024 Mortality Data on 30 August 2024. Australia’s Cumulative Excess Deaths Continue to Rise with March and April Deaths already exceeding 2022 and 2023 levels” (see link: https://substack.com/@supersally/p-148409401 ). As per the article: The failure of the Australian Government to recognize the continuing excess deaths post Covid-19 vaccine rollout represents a catastrophic failure of public health, as does the failed public enquiry into excess deaths. Deaths are the tip of the ice-berg underpinned by mass illness, disability, and abject human suffering. Australians deserve and should demand more from their Government. There are still too few voices calling for accountability, change, and support for those harmed.
2) Due Diligence and Art by Sasha Latypova August 9, 2024 “Did anyone in this country accept orders from the United States military…” (see link: https://sashalatypova.substack.com/p/repost-breaking-news-finally-the ). As per the article: Information now in the public domain indicates the COVID response was not initiated through commercial interests but, rather, through an organization called the Medical Countermeasures Consortium that Australia joined in 2012. The military appears to have been involved in the cover-up of COVID’s origins. It’s now clear that COVID was developed during gain-of-function research in China’s Wuhan Institute for Virology, connected with the Chinese military. Who funded this research in China? The military should not be used against law-abiding civilians or against healthy civilians for the purposes of forced injections to transfer wealth to big pharma. What we saw was forced injection of people after succumbing to the threat of deprivation of their family’s livelihood and their ability to feed children. Fear, intimidation, blackmail and threats of loss of income and home are elements of force…inhuman force.
The author of the CotD has combined analyses of Covid-19 and Excess Deaths (all causes) as these are related. This is an update of the November 22, 2023 Australia CotD.
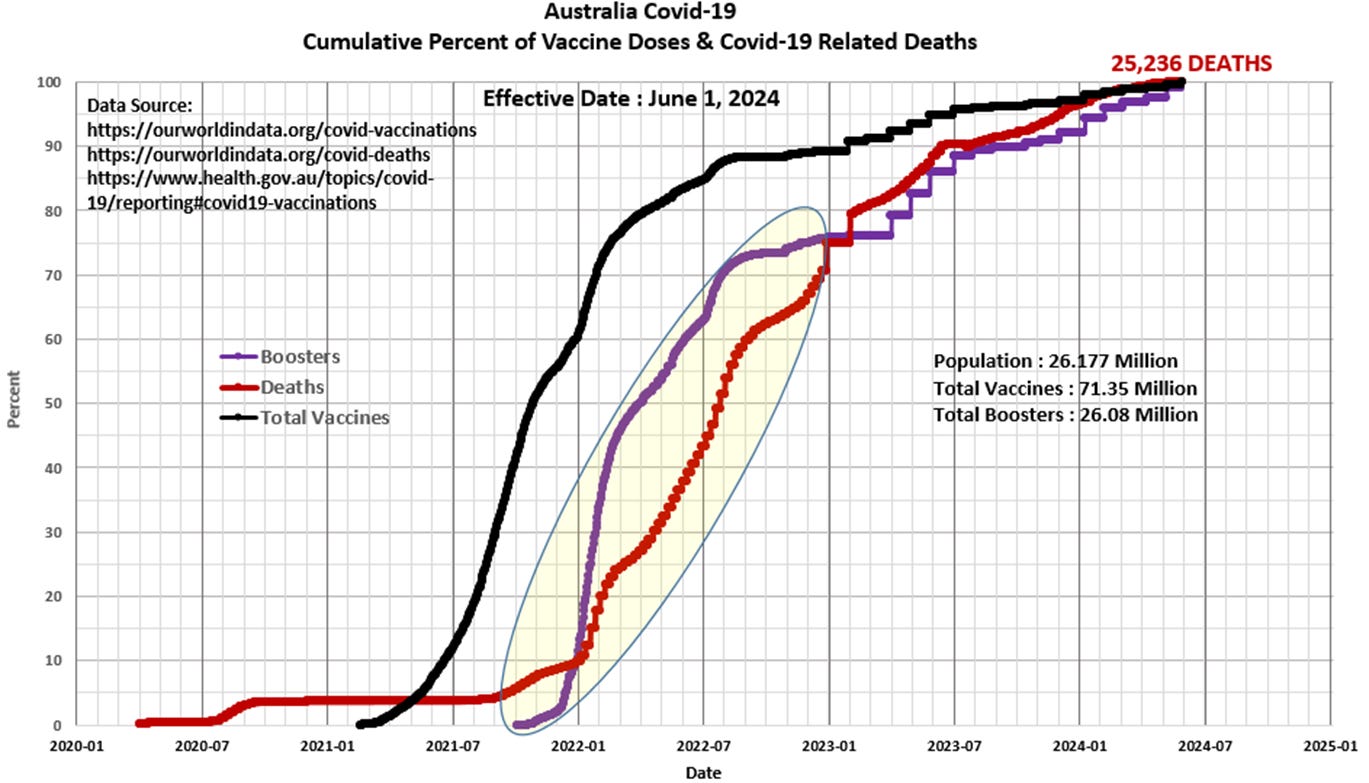
Panel 1 The first graph is a construct by the author as a standard CotD presentation which illustrates Covid-19 related deaths (CRDs) and vaccinations. Australia exhibited essentially “zero” Covid-19 related deaths (CRDs) between September 2020 and August 2021. The vaccination program was initiated in February 2021 which was 5 to 6 months into the “flat curve” period. The booster vaccination program was initiated in October 2021 which appears to have triggered the dramatic increase in CRDs starting in January 2022. The booster vaccination to CRDs correlation (yellow highlighted) is both self-evident and astounding to say the least. Note that there was no reduction in the CRD rate approaching the summer of 2022/23, even-though 90 percent of the vaccines had been administered by then. The CRD rate continued to climb into 2024, however, CRDs have subsided somewhat in concert with low vaccination uptake. Total CRDs to date represent 0.096 percent of the population. As per the Government of Australia Covid-19 Safety Report “Vaccination against COVID-19 is the most effective way to reduce deaths and severe illness from infection. The protective benefits of vaccination far outweigh the potential risks.” Do you think the data supports these claims?
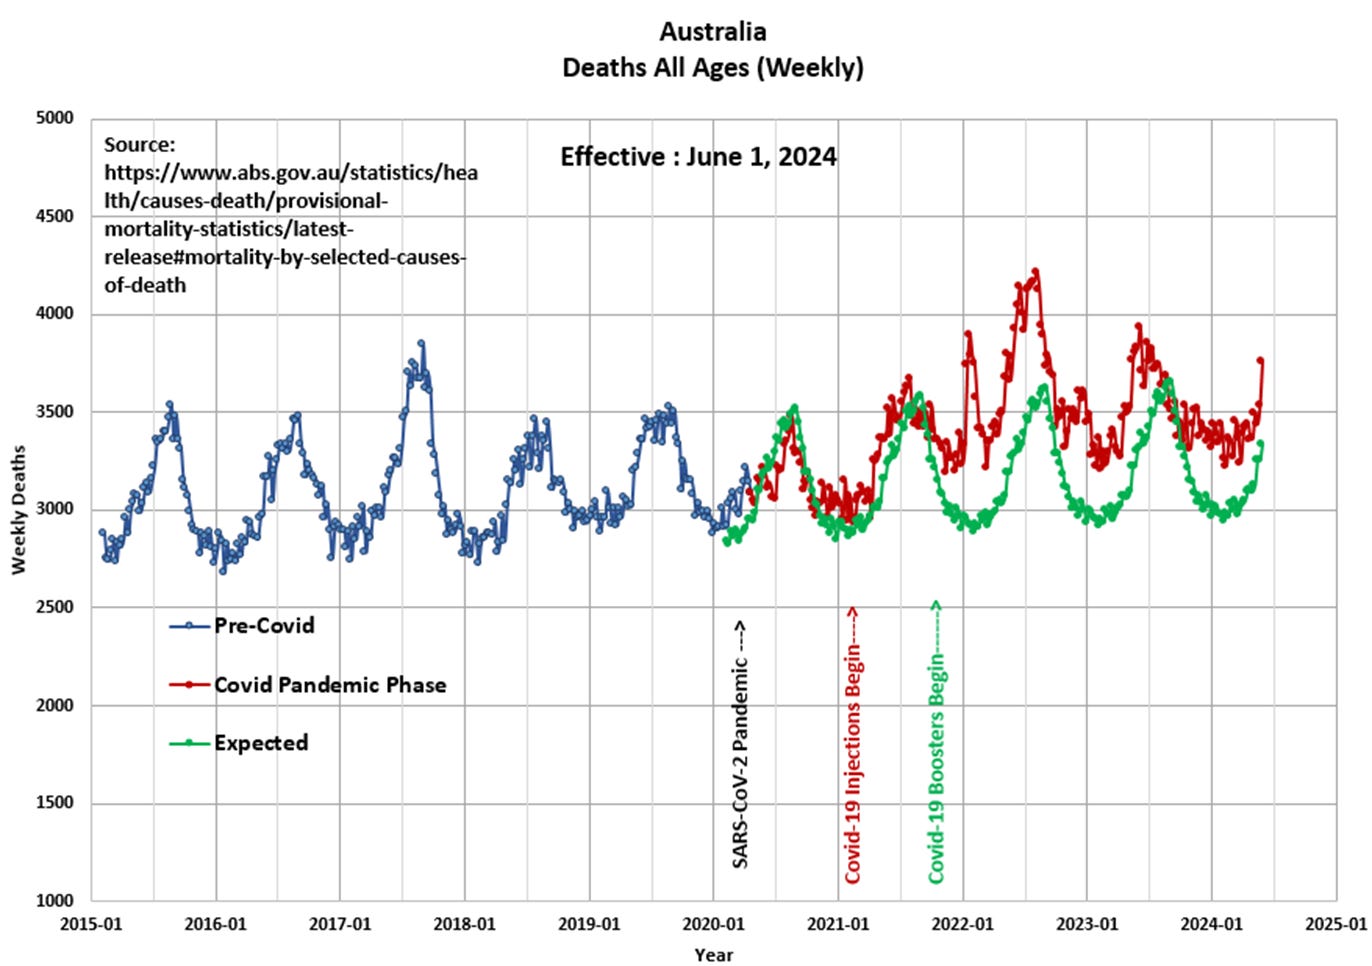
Panel 2 Observe the cyclical nature of deaths or all-cause mortality since 2015. The “Blue” line represents data prior to March 2020 and the “Red” line represents data since the SARS CoV-2 pandemic was initiated in March 2020. The “Green” line represents the “Expected” deaths (CotD Model) based on historical averages. The author has utilized the five year period January 2015 to December 2019 in order to calculate an average normalized curve for Weekly Deaths. The Expected (CotD Model) deaths incorporates an average 3.5 percent annual growth factor which appears to be a good match to the overall historical trend.
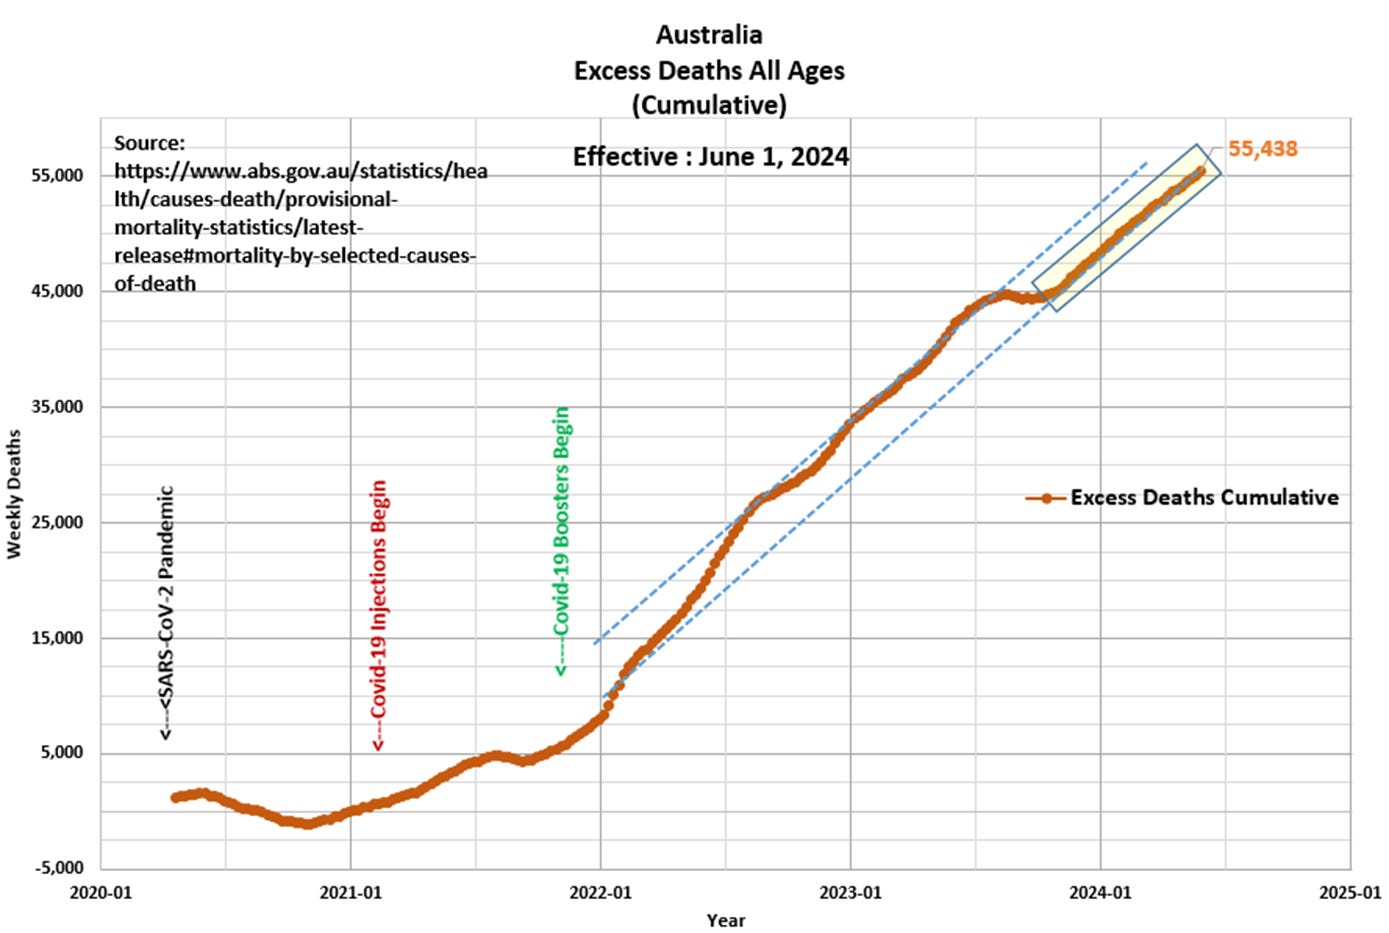
Panel 3 This presents the magnified portion (January 2020 to June 2024) of the graph in Panel 2. The “Orange” line represents “Excess Deaths” which is calculated by subtracting Expected Deaths from Official Deaths.
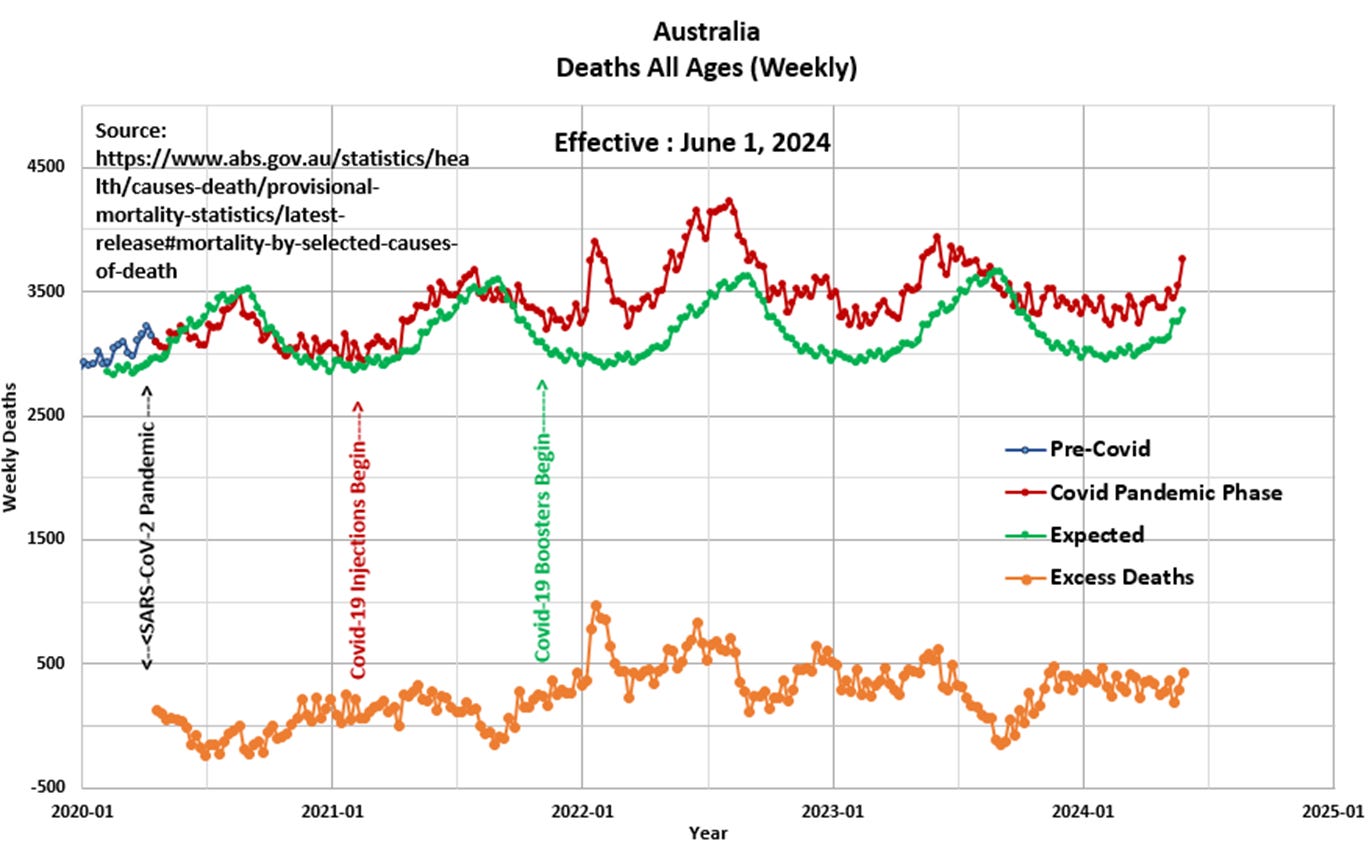
Panel 4 Based on the data and this author’s model 55,438 Excess Deaths have occurred since the start of the pandemic, of which 54,685 Excess Deaths (98.6 percent) have occurred since the start of Covid-19 injections in February 2021. This compares to 33,964 Excess Deaths since the start of the pandemic as per the Australia Bureau of Statistics https://www.abs.gov.au/statistics/health/causes-death/provisional-mortality-statistics/latest-release#mortality-by-selected-causes-of-death website. Note that the weekly Excess Death rate has been essentially linear since January 2022. Something is awry in Australia and the citizens must demand to know “why are these excess deaths occurring?”.
“We are all visitors to this time, this place. We are just passing through. Our purpose here is to observe, to learn, to grow, to love…and then we return home” Australian Aboriginal Proverb


