by Eldric Vero
September 7, 2024
The following articles are relevant to this CotD :
1) Brookings Institute July 30, 2020 “Tunisia may have beaten COVID-19, but challenges persist” (see link: Tunisia may have beaten COVID-19, but challenges persist (brookings.edu)). As per the article: Tunisia was one of the first countries in the Middle East and North Africa (MENA) to successfully contain the coronavirus outbreak. Tunisia’s success in dealing with the pandemic can be attributed to a combination of factors, including a relatively robust healthcare system, a swift and effective government response, citizen trust in government performance, and public awareness of the dangers of the virus.
2) Aljazeera July 17, 2021 “Tunisia reports highest COVID death toll since start of pandemic” (see link: Tunisia reports highest COVID death toll since start of pandemic | Coronavirus pandemic News | Al Jazeera ). As per the article: Tunisia has registered its highest number of daily COVID-19 deaths since the start of the pandemic as the Delta variant of the coronavirus spreads and vaccine availability remains low. Last week, the health ministry warned that the health system had “collapsed” amid a significant influx of patients in hospitals. “The boat is sinking,” Health Ministry Nisaf Ben Alaya said, calling on Tunisians to unite in efforts to combat the pandemic.
The author of the CotD has combined analyses of Covid-19 and Excess Deaths (all causes) as these are related.
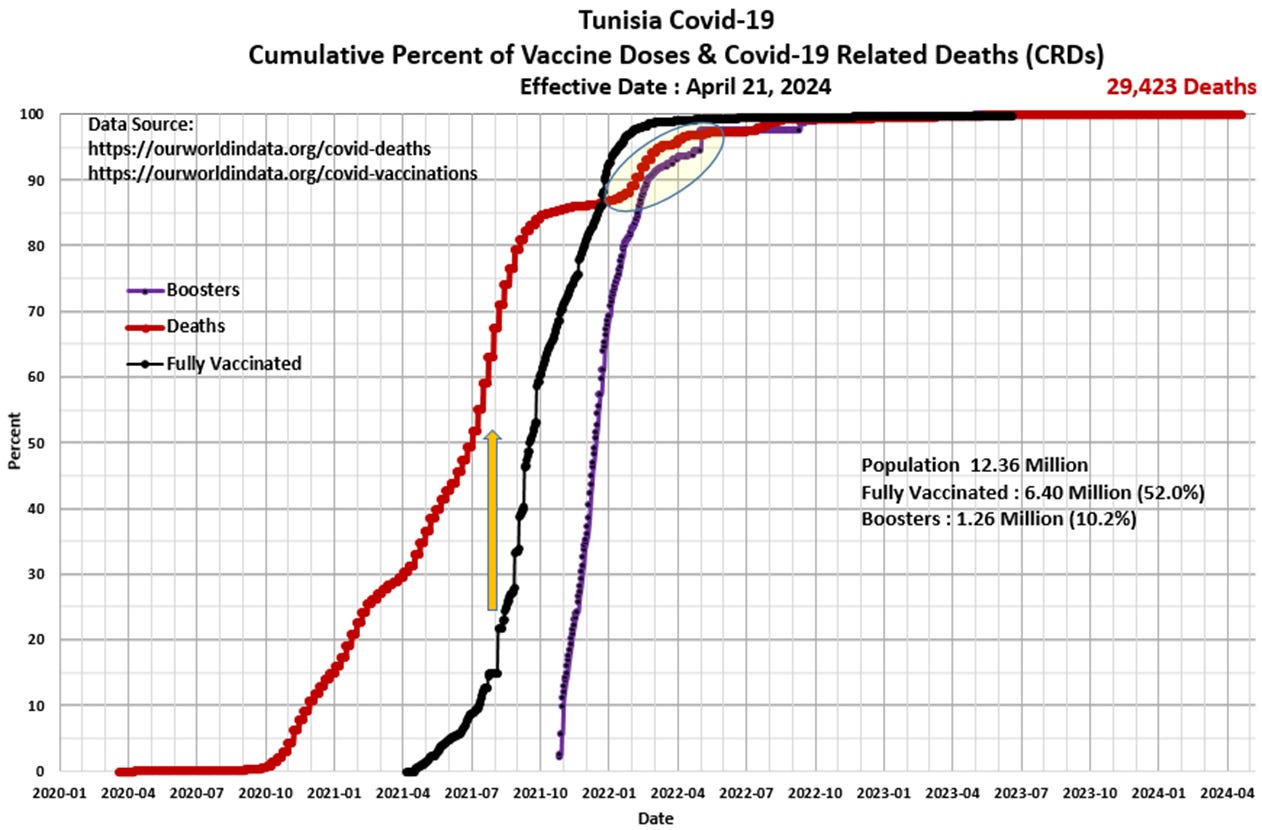
Panel 1 The first graph is a construct by the author as a standard CotD presentation which illustrates Covid-19 related deaths (CRDs) and vaccinations. Observe the extremely low CRD rate from March to October 2020, which then took-off in Q4’2020 at an accelerated rate. The vaccination program began in March 2021 with no positive effect on reducing the CRD rate. Three to four months into the injection program, the CRD rate essentially doubled over the four month period July to October 2021. The CRD rate subsided somewhat in Q4’2021, however, increased again in Q1’2022, shortly after the booster injections began. The vaccine-to-death correlation appears to be self-evident as the curves are near 100 percent mirror images. During the initial injection campaign, the CRD rate peaked at 1,258 Tunisian citizens dying during one week in July 2021 (180 deaths per day), which was absolutely tragic to say the least. The CRD rate has subsided significantly and is essentially zero since Q1’2023 as injection uptake has basically ended.
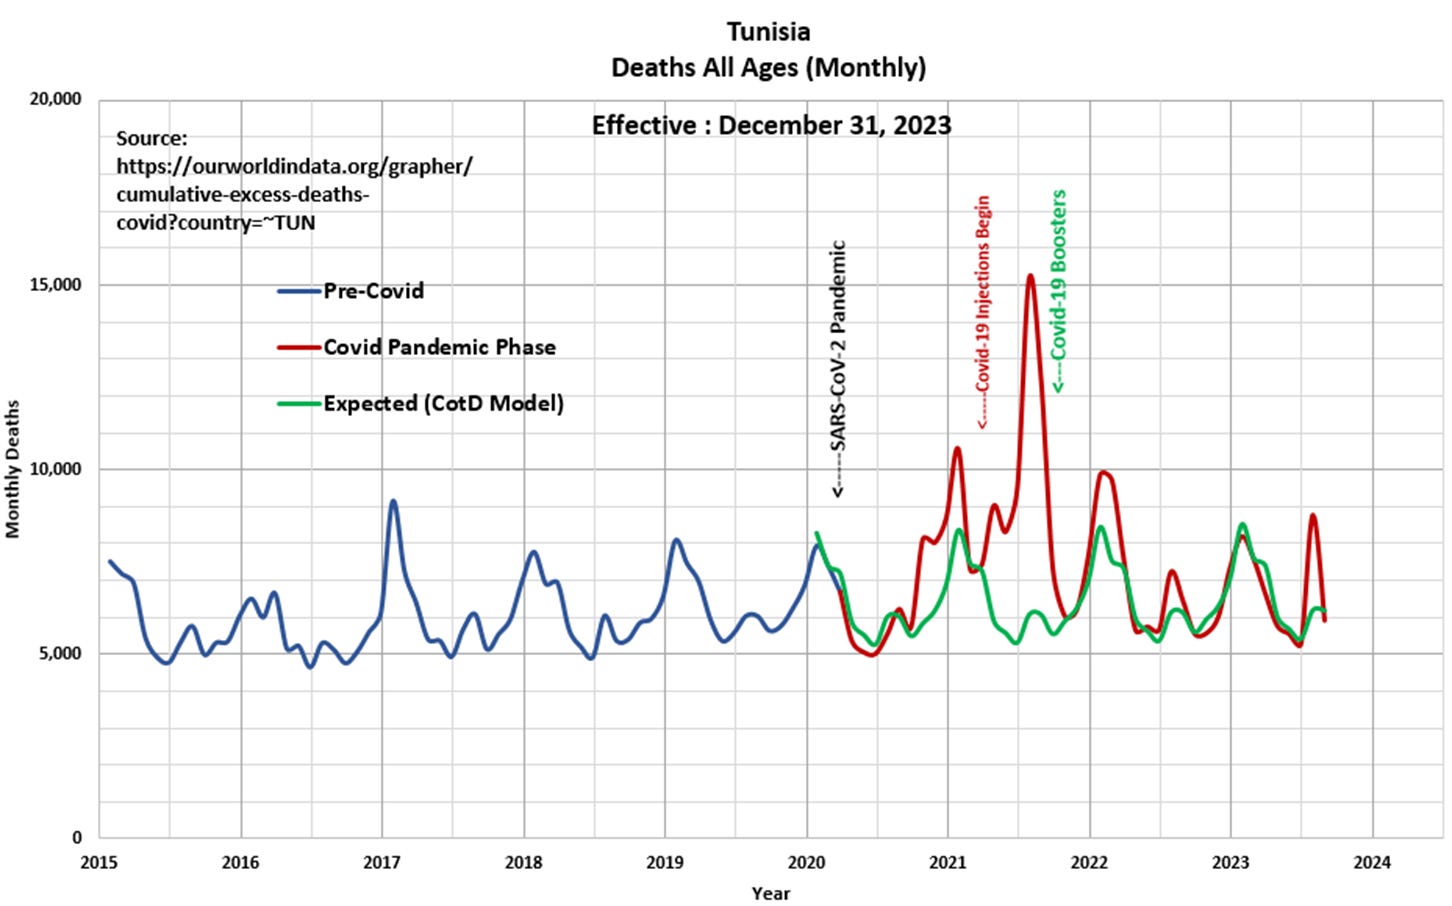
Panel 2 Observe the cyclical nature of deaths or all-cause mortality since 2015. The “Blue” line represents data prior to March 2020 and the “Red” line represents data since the SARS CoV-2 pandemic was initiated in March 2020. The “Green” line represents the “Expected” deaths (CotD Model) based on historical averages. The author has utilized the five year period January 2015 to December 2019 in order to calculate an average normalized curve for Weekly Deaths. The Expected (CotD Model) deaths incorporates an average 8.0 percent growth factor (one of the highest evaluated to date) which appears to be a good match to the overall trend.
Panel 3 This presents the magnified portion (January 2020 to August 2023) of the graph in Panel 2. The “Orange” line represents “Excess Deaths” which is calculated by subtracting Expected Deaths from Official Deaths. Note the huge spike in deaths (near 100 percent above previous historical spikes) in July 2021, about four months after the injections were initiated.
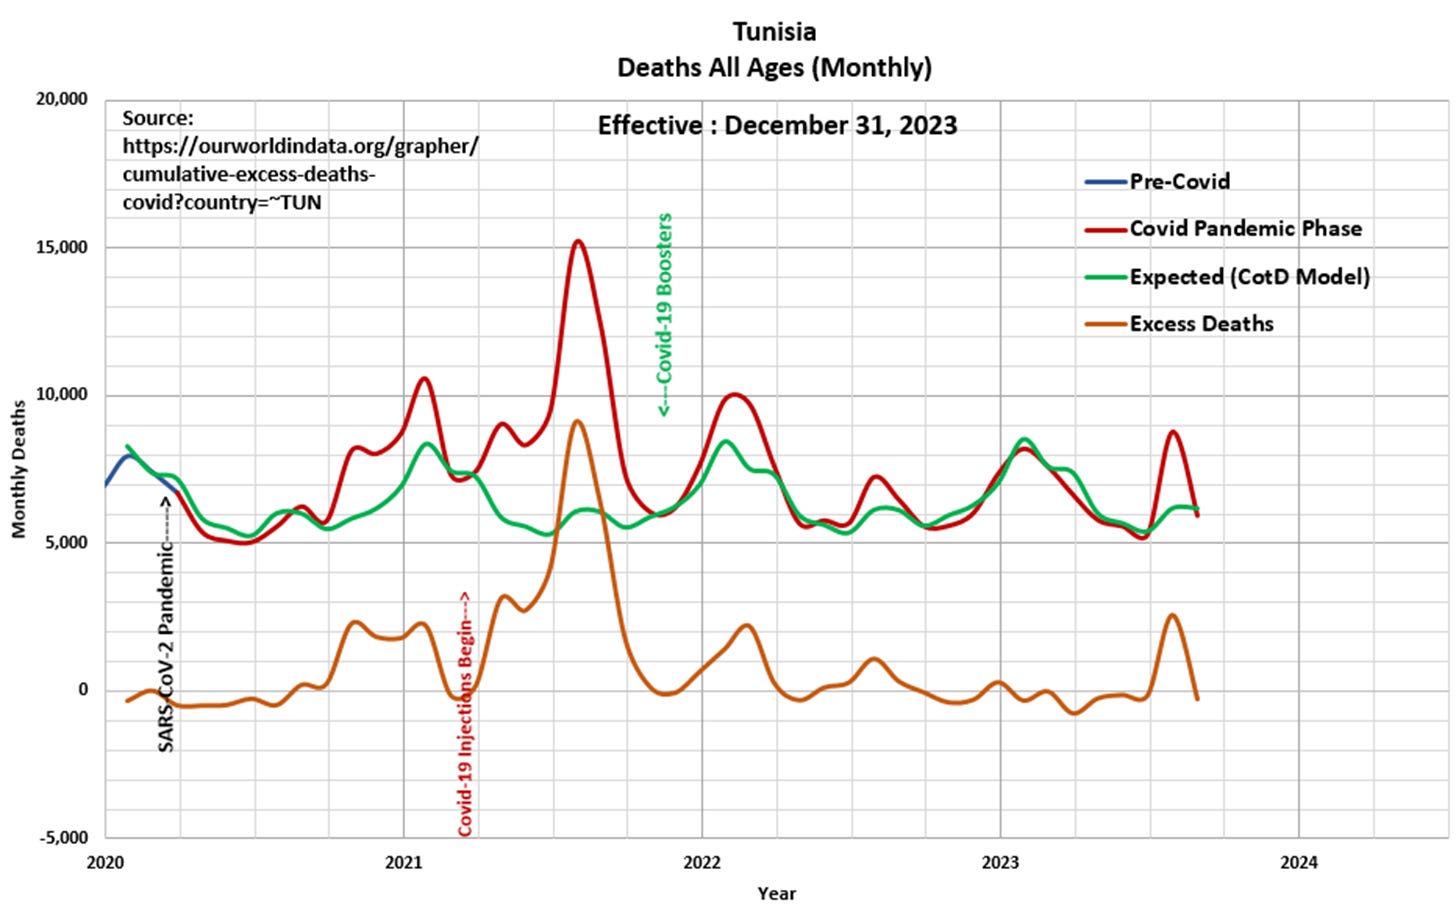
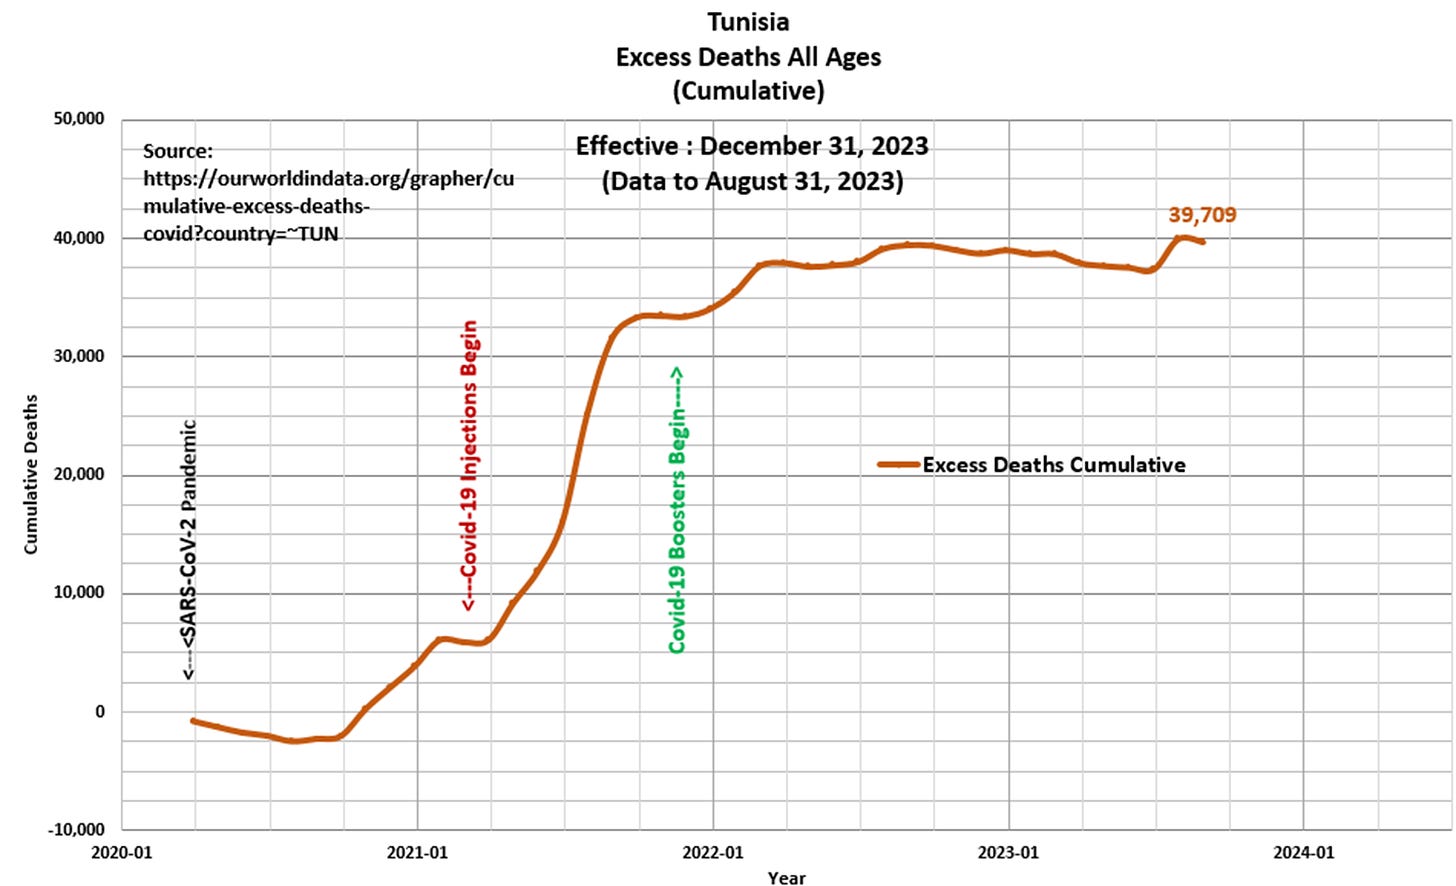
Panel 4 Based on the data and this author’s model 39,709 Excess Deaths have occurred since the start of the pandemic, of which 33,642 Excess Deaths (85 percent) have occurred since the start of Covid-19 injections in March 2021. This compares to 28,255 Excess Deaths since the start of the pandemic as per the ourworldindata.org website.
“Who came back from the grave and told the story?” Tunisian Proverb


