by Eldric Vero
September 23, 2024
The following articles are relevant to this CotD:
1) CBC News April 12, 2022 “Long a pandemic leader, Nova Scotia is now a COVID-19 hot spot” (see link: https://www.cbc.ca/news/canada/nova-scotia/covid-19-north-america-hot-spots-nova-scotia-cases-1.6414672 ). As per the article: “The fact that it continues to go up and the percentage of people that are positive in that group means that there’s really a lot of virus out there,” said Dr. Lisa Barrett, an infectious diseases doctor and researcher at Dalhousie University in Halifax. Barrett is encouraging people to get their COVID-19 booster shots, as well as follow the steps Nova Scotia used to great success earlier in the pandemic, which includes wearing masks and limiting social contacts.
2) CBC News September 15, 2022 “N.S. reports 15 COVID-19 deaths in latest weekly update” (see link: https://www.cbc.ca/news/canada/nova-scotia/covid-19-update-sept-15-2022-august-stats-1.6584037 ). From the article: Nova Scotia reported 15 deaths from COVID-19 for the week ending Sept. 12, the province’s updated COVID-19 dashboard showed Thursday. The median age of deaths for this reporting week is 83.
(The average life expectancy is 80 years in Nova Scotia – addendum via the CotD author).
The author of the CotD has combined analyses of Covid-19 and Excess Deaths (all causes) as these are related.
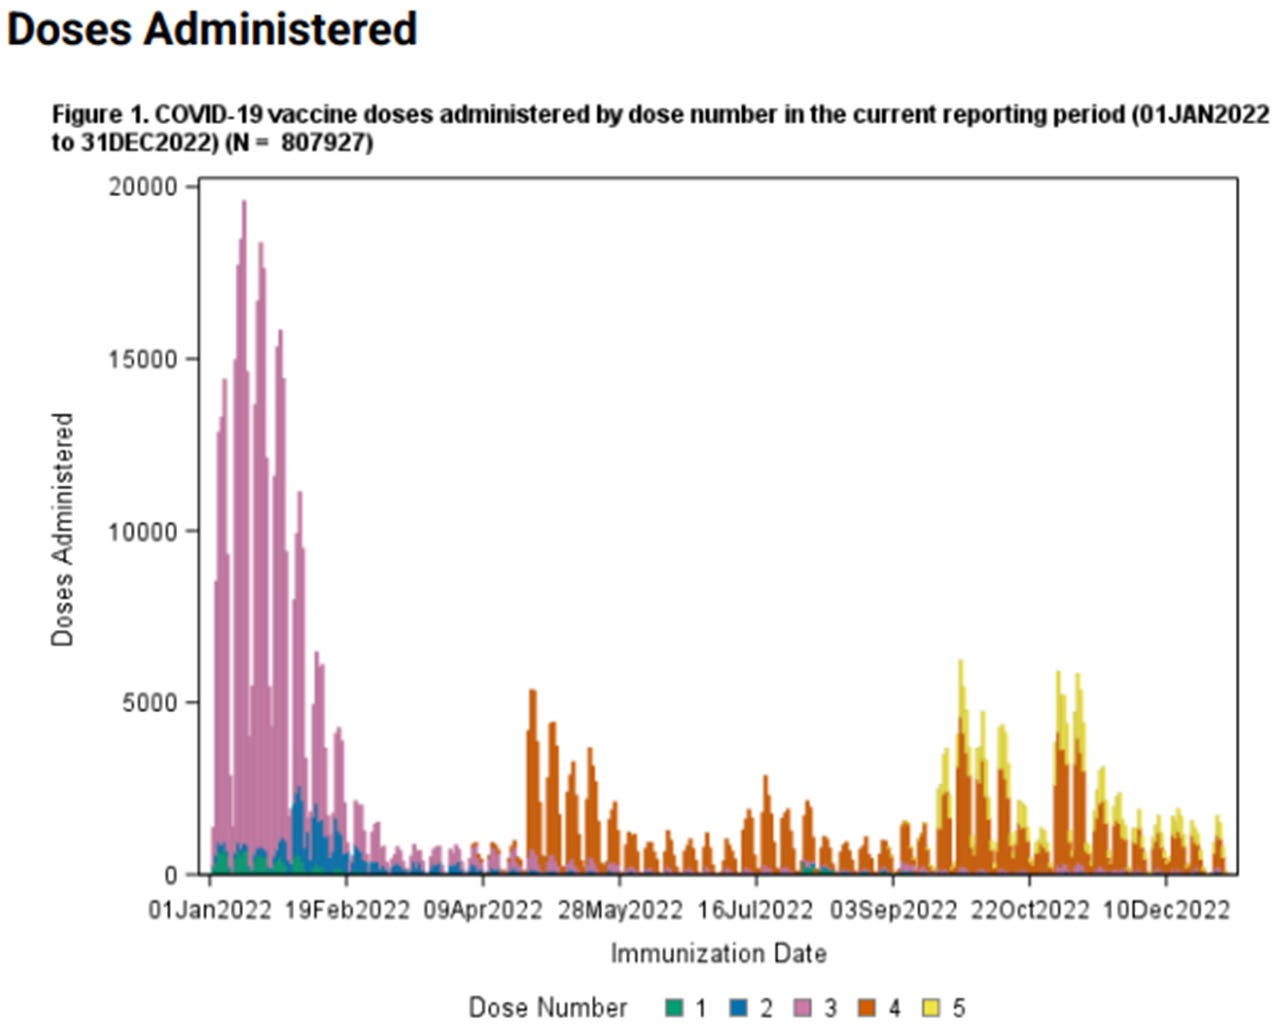
Panel 1 The first graph is Figure 1 within the Nova Scotia January 31, 2023 report on “Adverse Events Following Immunization (AEFIs) with COVID-19 Vaccines in Nova Scotia (January 1, 2022 to December 31, 2022)” which is the most recent report the CotD author could find (see link : https://novascotia.ca/coronavirus/docs/adverse-events-following-immunization-with-COVID-19-vaccines-2022-12-31.pdf ).
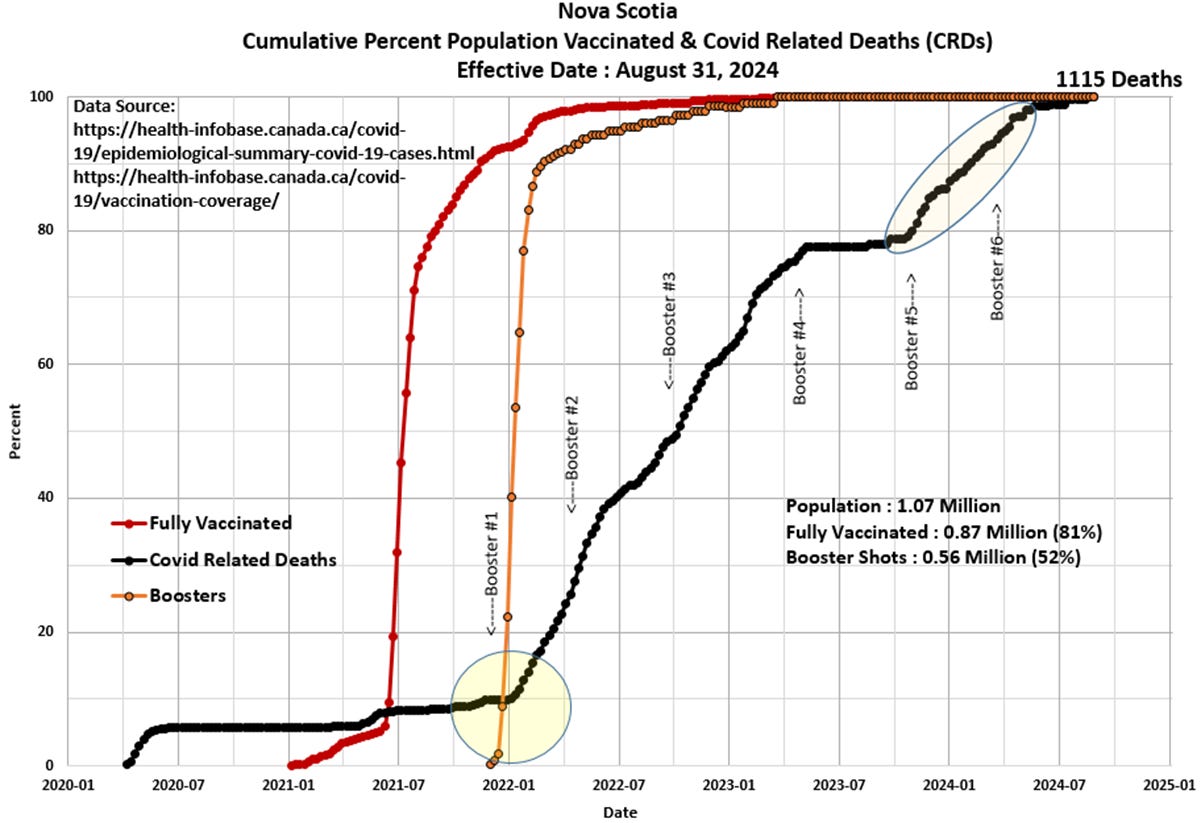
Panel 2 This graph is a construct by the author as a standard CotD presentation which illustrates Covid-19 Related Deaths (CRDs) and vaccinations. Nova Scotia’s vaccination program was initiated in January 2021 (after seven months of no CRDs – the curve was flat) and began to accelerate significantly into the summer of 2021. There was a minor CRD uptick in the second half of 2021, however, the CRD rate appeared to be contained indicating potential vaccine effectiveness. The Booster program was initiated in January 2022 and ramped-up at an extremely high rate in Q1’2022 and tapered-off thereafter. Note the significant increase in the CRD rate coincident to the Booster injections which have continued since then. The vaccine-to-death correlation appears to be self-evident. Remember, as per Health Canada: “Evidence indicates that vaccines and boosters are effective at helping to prevent serious illness, hospitalization and death due to COVID-19. Evidence indicates that the benefits of COVID-19 vaccines continue to outweigh the risks of the disease. Receiving an mRNA booster dose provides even better protection.” Do you think the data supports these claims by Health Canada?
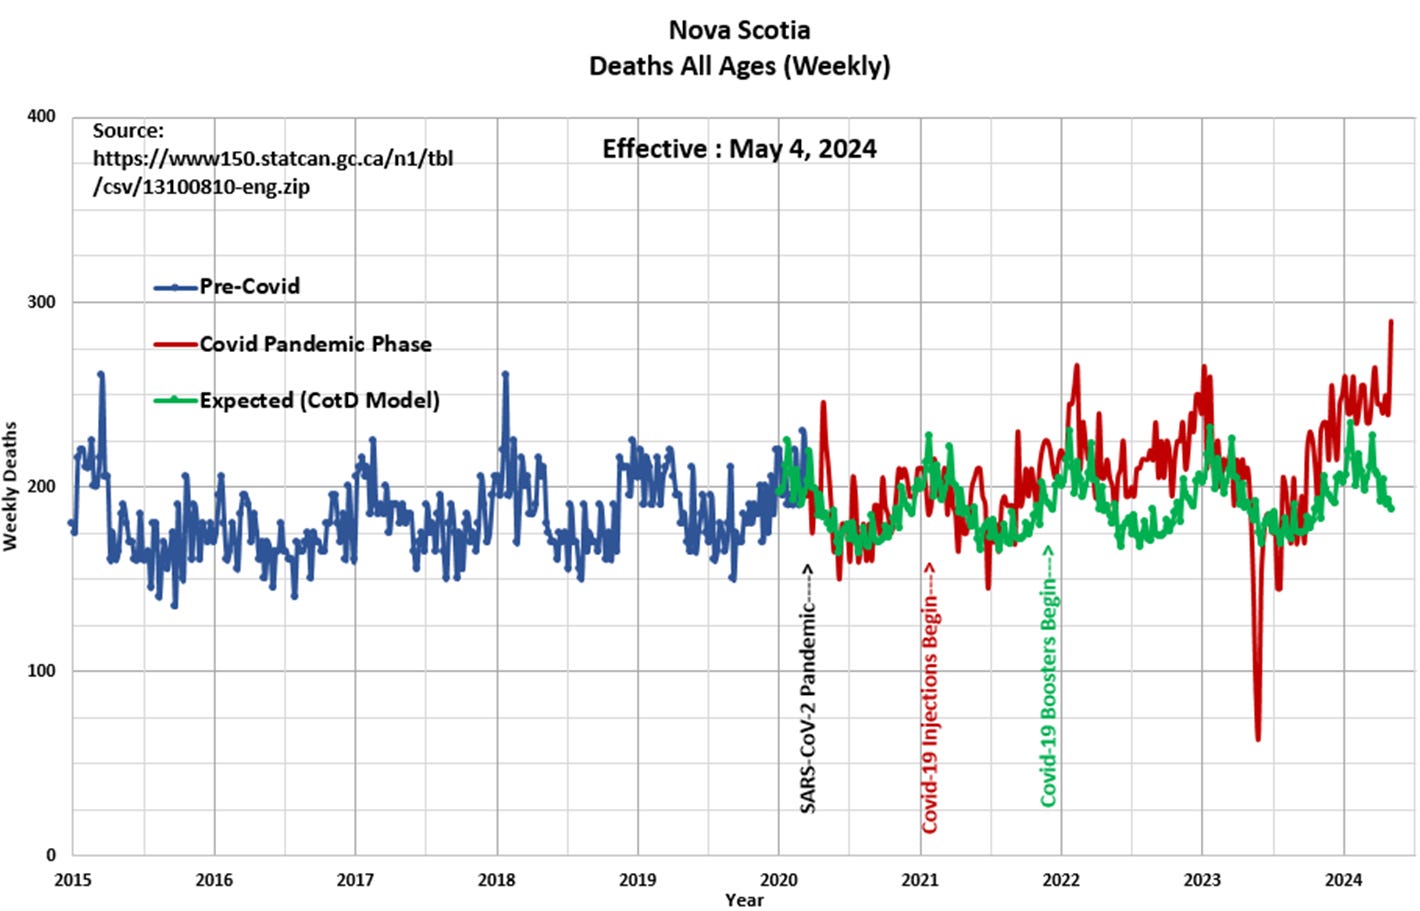
Panel 3 Observe the characteristic cyclical nature of deaths or all-cause mortality since 2015. The “Blue” line represents data prior to March 2020 and the “Red” line represents data since the SARS CoV-2 pandemic was initiated in March 2020. The “Green” line represents the “Expected” deaths (CotD Model) based on historical averages. The author has utilized the data for the five year period January 2015 to December 2019 in order to calculate an average normalized curve for Weekly Deaths. The Expected Deaths (CotD Model) incorporates an average 4.0 percent growth factor which appears to be a good match to the overall pre-pandemic trend.
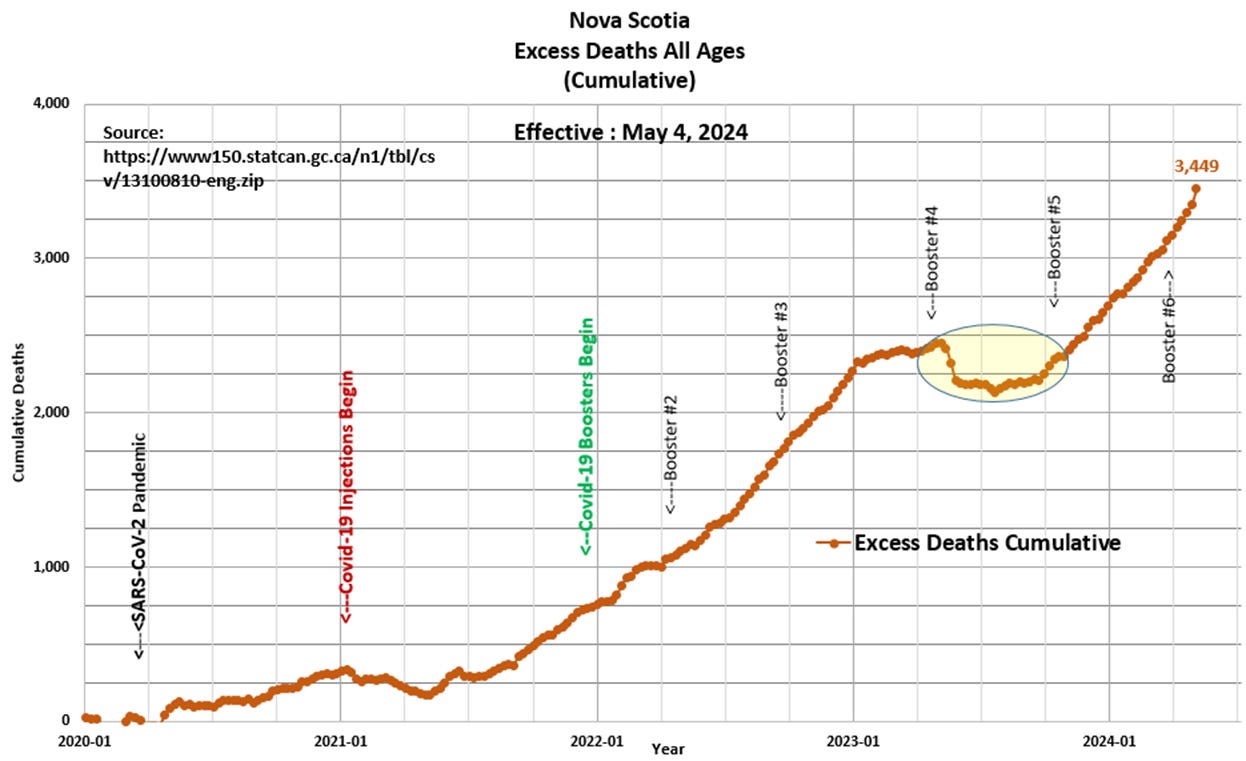
Panel 4 This presents the magnified portion January 2020 to May 2024 of the graph in Panel 2. The “Orange” line represents “Excess Deaths” which is calculated by subtracting Expected Deaths from Official Deaths.
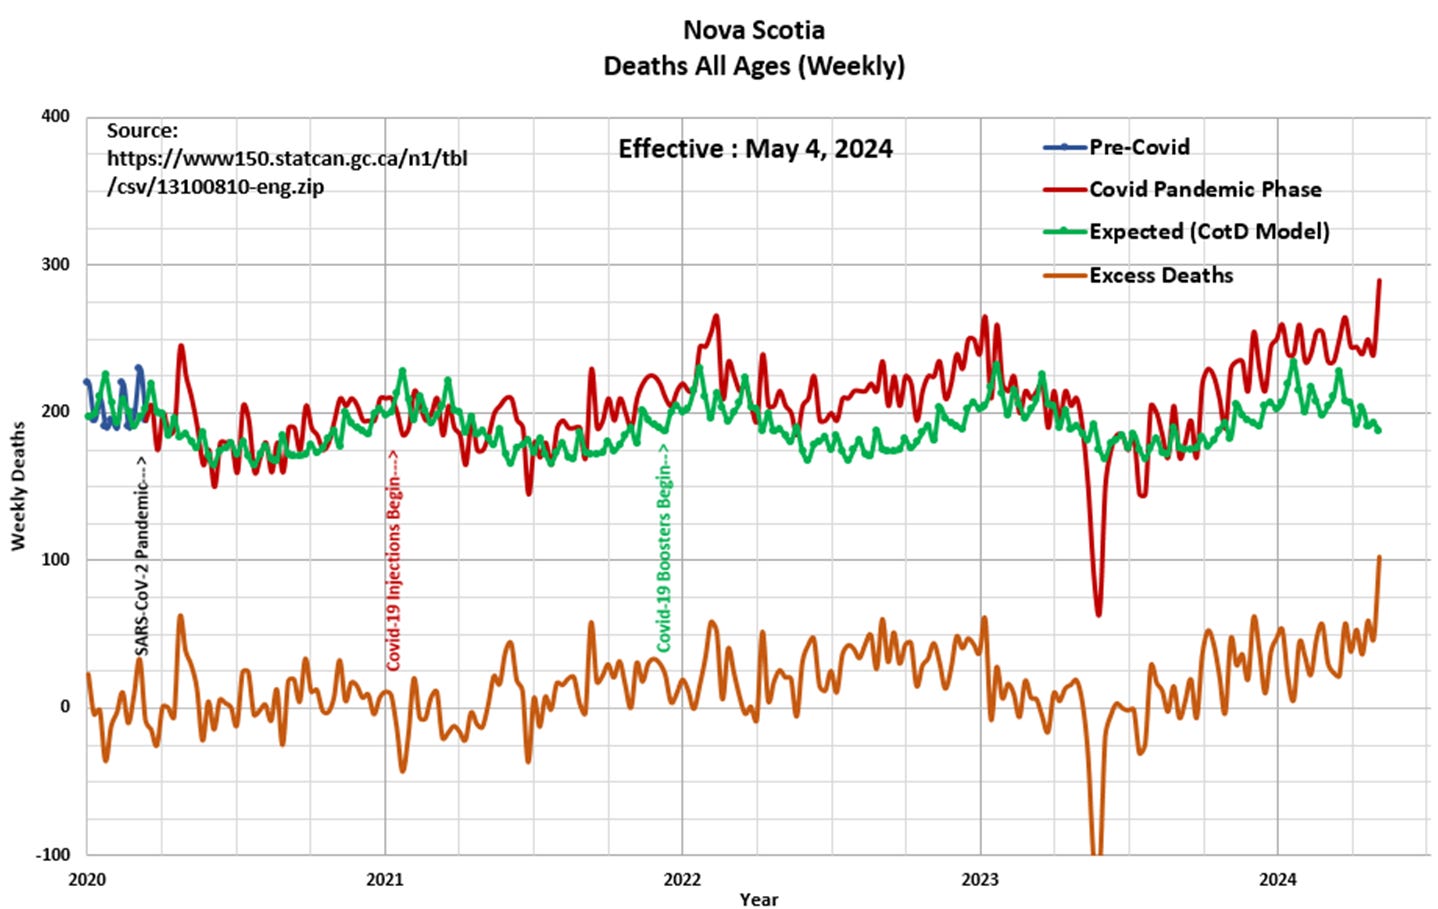
Panel 5 Based on the data and this author’s model 3,449 Excess Deaths have occurred since the start of the pandemic of which 3,116 (90 percent) have occurred since the start of Covid-19 injections in January 2021. The Statistics Canada website is current to September 30, 2023 with Nova Scotia Excess Deaths at 1,135 Excess Deaths since the start of the pandemic to May 6, 2023, as there is no data beyond this date. For comparison purposes, the CotD Model calculates 2,452 Excess Deaths to May 6, 2023. The period from May to September 2023 is an interesting data set (highlighted yellow) with a decrease in cumulative Excess Deaths – data anomaly? Note that since September 2023, the Excess Death Rate (EDR) is once again accelerating in an exponential phase (mirroring 2022), which is a strong signal something is abnormal within Nova Scotia’s highly Covid-19 vaccinated population. Once again, the question is “why is this occurring?
“The truth is out there” (X Files TV series)


