by Eldric Vero
October 17, 2024
The following articles are relevant to this CotD:
1) National Post April 25, 2022 “Natural immunity provides strong protection from COVID reinfection, but vaccination still safer” (see link: https://nationalpost.com/health/natural-immunity-provides-strong-protection-from-covid-reinfection-but-vaccination-still-safer ). As per the article: New research shows that a COVID-19 infection can grant the unvaccinated strong and durable protection from reinfection, or mild or severe COVID – protection that even stacks up to that reported for mRNA vaccines. The researchers found a past infection was 85 per cent protective against reinfection, and 88 per cent protective against hospitalization. The researchers didn’t see any waning in the level of protection up to nine months out from the initial infection.
2) Dr. Mark Trozzi substack October 4, 2024 “COVID Injections: Unveiling the Mechanisms of Harm” (see link: https://substack.com/@drmtrozzi/p-142821745 ). From the article: New pathology, a new wave of disease, and 44 common examples of injection-induced illnesses supported by over 930 scientific publications linking these diseases with the injections. Yet, despite diligent efforts to warn the public, elected officials, and bureaucrats, billions of people (many repeatedly) have been subjected to these injections in what can only be described as a radical and unethical medical experiment. In many countries, including Canada, doctors who voiced caution were unlawfully persecuted – our careers, incomes and reputations tarnished. (CotD author comment “this is an excellent substack article summarizing the mechanisms of harm…a must read).
The author of the CotD has combined analyses of Covid-19 and Excess Deaths (all causes) as these are related.
Panel 1 This graph is a construct by the author as a standard CotD presentation which illustrates Covid-19 Related Deaths (CRDs) and vaccinations. Ontario’s vaccination program was initiated in December 2020 and began to accelerate significantly in Q2’2021 and continuing to Q4’2021. There appeared to be some success to vaccination in mid-2021 as the CRD rate decreased somewhat with approximately 70 percent of the population fully vaccinated. The Booster program was initiated in December 2021 and ramped-up at an extremely high rate in Q1’2022 and tapered-off thereafter. Note the significant increase in the CRD rate (high-lighted yellow) coincident to the Booster injections which have continued since then. The vaccine-to-death correlation appears to be self-evident. Remember, as per Health Canada: “Evidence indicates that vaccines and boosters are effective at helping to prevent serious illness, hospitalization and death due to COVID-19. Evidence indicates that the benefits of COVID-19 vaccines continue to outweigh the risks of the disease. Receiving an mRNA booster dose provides even better protection.” Do you think the data supports these claims by Health Canada?

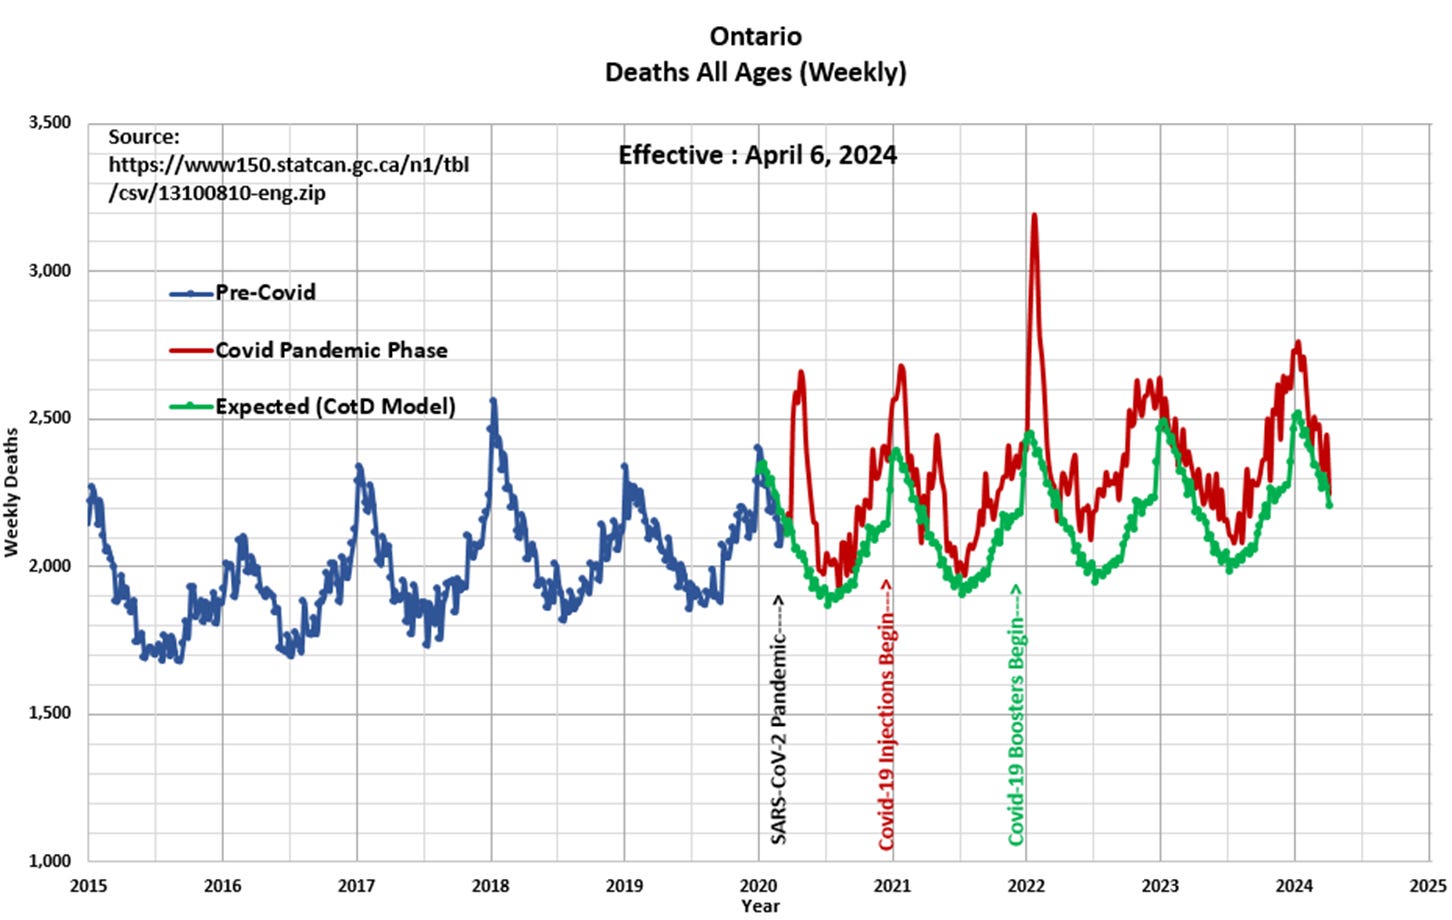
Panel 2 Observe the characteristic cyclical nature of deaths or all-cause mortality since 2015. The “Blue” line represents data prior to March 2020 and the “Red” line represents data since the SARS CoV-2 pandemic was initiated in March 2020. The “Green” line represents the “Expected” deaths (CotD Model) based on historical averages. The author has utilized the data for the five year period January 2015 to December 2019 in order to calculate an average normalized curve for Weekly Deaths. The Expected Deaths (CotD Model) incorporates an average 7.75 percent growth factor which appears to be a good match to the overall pre-pandemic trend.

Panel 3 This presents the magnified portion January 2020 to April 2024 of the graph in Panel 2. The “Orange” line represents “Excess Deaths” which is calculated by subtracting Expected Deaths from Official Deaths.

Panel 4 Based on the data and this author’s model 39,571 Excess Deaths have occurred since the start of the pandemic of which 31,312 (79 percent) have occurred since the start of Covid-19 injections in December 2020. The Statistics Canada website is current to September 30, 2023 with Ontario Excess Deaths at 31,594 Excess Deaths since the start of the pandemic to July 15, 2023 as there is no data beyond this date. For comparison purposes, the CotD Model calculates 32,523 Excess Deaths to July 15, 2023. The blue-dashed curve is a polynomial (non-linear) best-fit to the data up-trend. In essence, this reveals that the Excess Death Rate (EDR) is at an elevated deviated phase with time, which is a strong signal something is abnormal within Ontario’s population. Once again, the question is “why is this occurring?

“Be a light of love in a dark and troubled world…Never let anyone dim the light in your heart and soul”. Bette Kelley


