by Eldric Vero
December 20, 2024
The following articles are relevant to this CotD:
1) Easton Spectator August 31, 2023 by Brian Peckford “Clean Up Your Own Act” (see link: https://www.eastonspectator.com/2023/08/31/clean-up-your-own-act-by-brian-peckford/ ). As per the article: How about living within your means and reduce borrowing thereby reducing inflation. You are borrowing just keep the lights on!!
2) True North News December 18, 2024 “B.C. projects $9.4B deficit, blowing past record-breaking 2024 budget shortfall” (see link: https://tnc.news/2024/12/18/bc-9-4b-deficit-record-breaking-2024-shortfall/ ). As per the article: British Columbia’s fiscal situation has deteriorated even further, with the projected 2024/25 deficit soaring to $9.4 billion, a $1.5 billion increase from the initial record-breaking Budget 2024 forecast. Taxpayers and business groups have blasted the economic update as jeopardising the province’s fiscal future. The escalating debt burden translates into significant interest costs for taxpayers. British Columbians are expected to pay $4.3 billion annually in interest on the provincial debt, amounting to $757 per resident.
British Columbia government recently released the “Fall 2024 Fiscal and Economic Update” (see https://news.gov.bc.ca/releases/2024FIN0052-001665 ). The following is a presentation of the government of British Columbia historical deficits and debts since 1997. Sources for this data include the following:
BC Public Accounts Archive : https://www2.gov.bc.ca/gov/content/governments/finances/public-accounts/archive
Canadian Taxpayers Federation Debt Clock : https://www.debtclock.ca/provincial-debtclocks/british-columbia/british-columbia-s-debt/
Tax Tips BC Provincial Debt: /
Panel 1
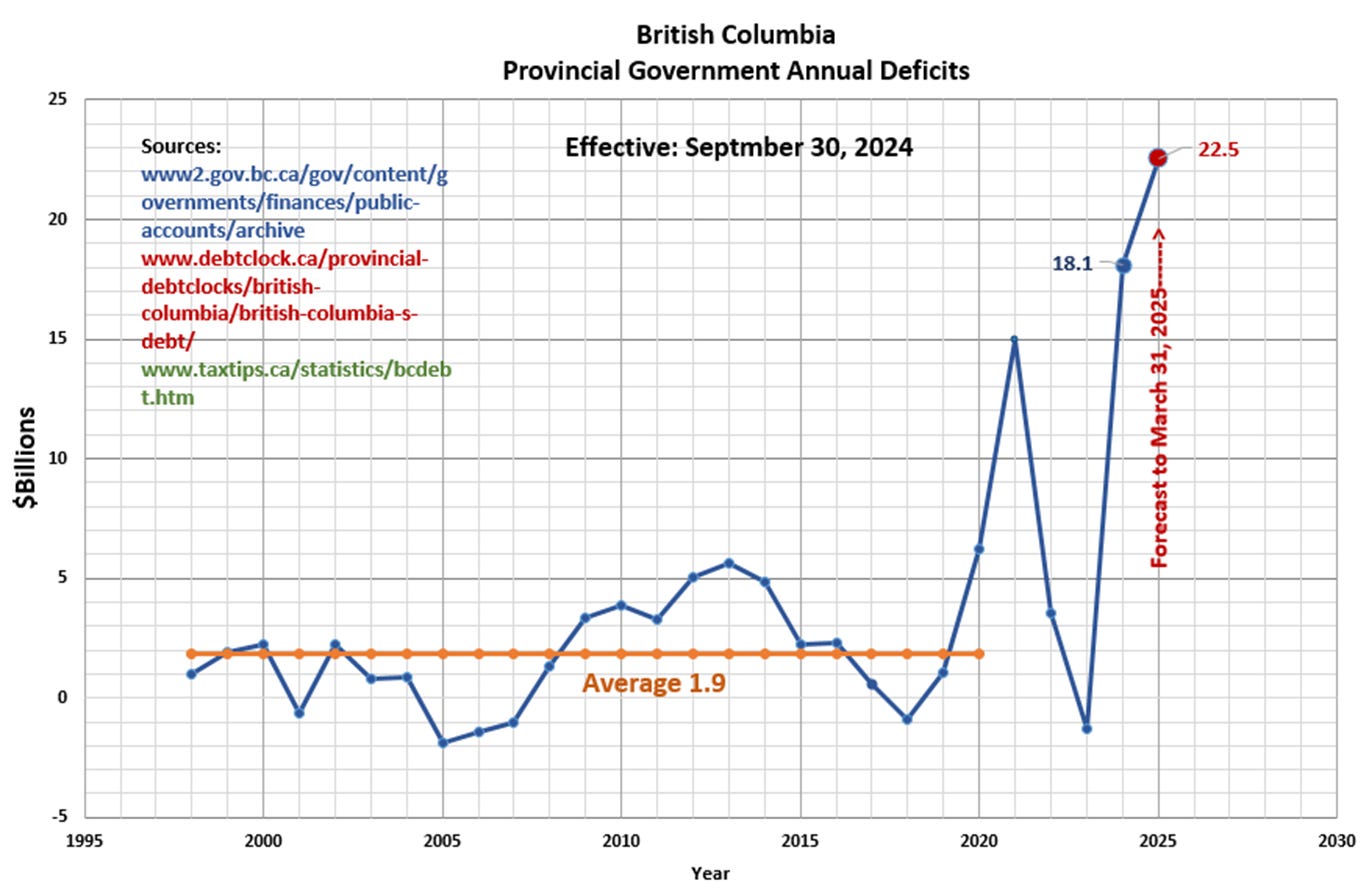
This graph presents the government of British Columbia annual deficits contributing to the overall cumulative debt. The CotD author utilizes cumulative debt to calculate the annual deficits over time. Note the extreme deficit projected at $22.5 billion in Fiscal 2024/25 ending March 31, 2025. This deficit is nearly 12 times the average annual deficits since 1997 (i.e. over 9 standard deviations) and highest in history. Total provincial deficit calculates at $40.6 billion over the past two fiscal years…unbelievable!

Panel 2
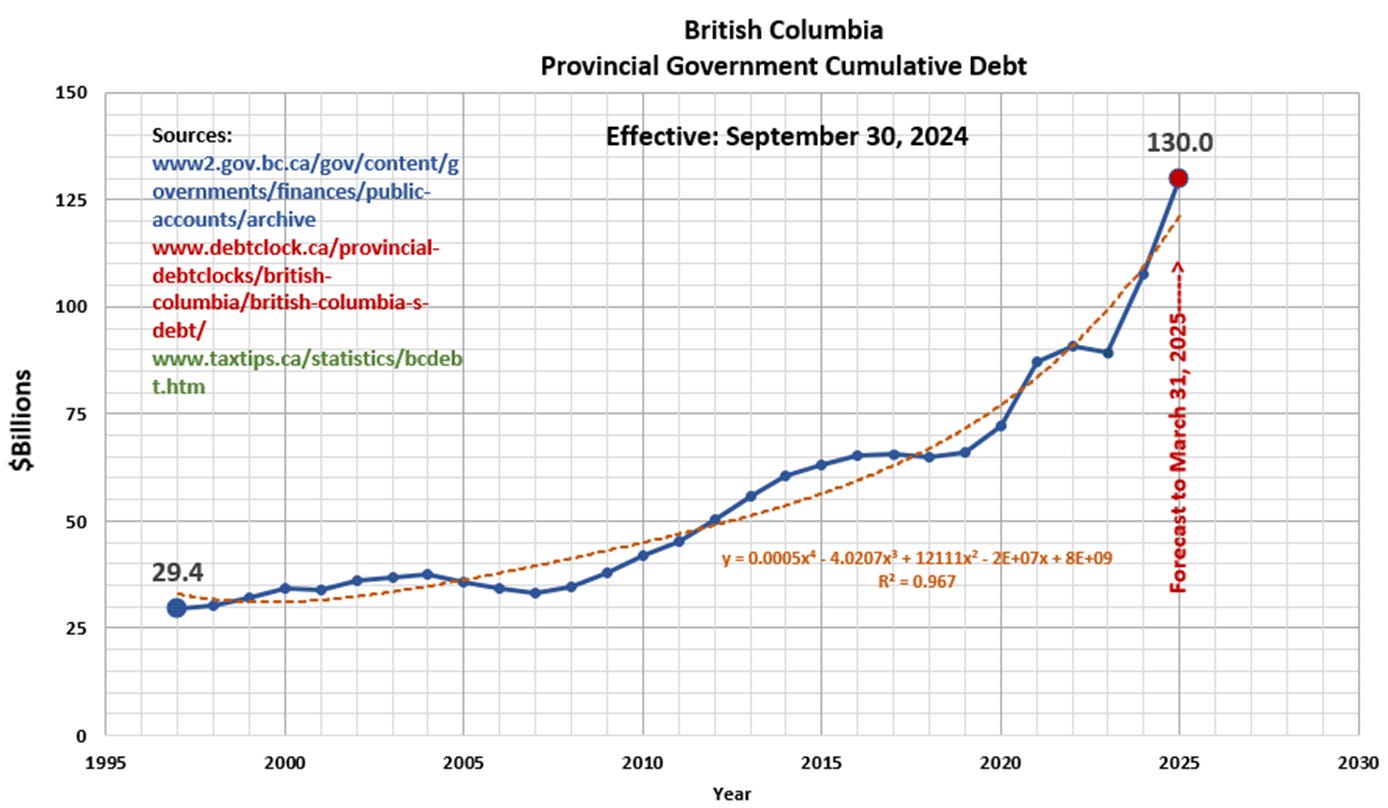
This is the graphical presentation of the government of British Columbia cumulative debt since 1997. Note the relatively stable deficits from 1997 to 2007 which includes a period of debt reduction from 2005 to 2007.Since 2007, the debt has increased by about $97 billion (tripled) to $130 billion and is projected by the CotD author to reach a conservative $140 billion by year-end 2025. The orange-dashed curve is a polynomial (non-linear) best-fit to the data up-trend (note R2=0.967 indicating a strong trend match).In essence, this reveals that the cumulative debt is at an elevated deviated phase with time and appears to be going somewhat hyperbolic. The question to be asked “is this sustainable?”

Panel 3
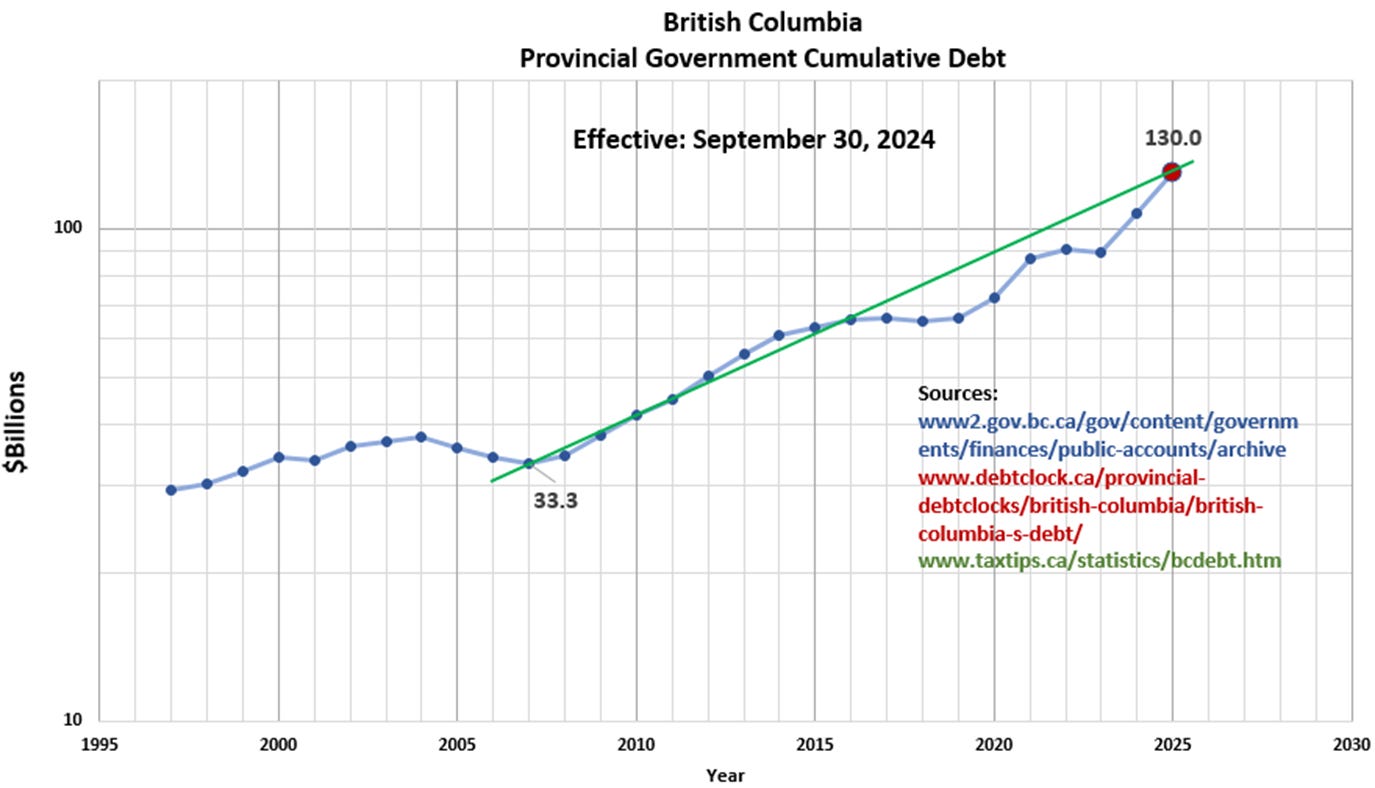
This is the same government of British Columbia cumulative debt as above, presented on a semi-logarithmic plot. The green line represents an average debt increase of 7.9 percent per year since 2007.

Panel 4
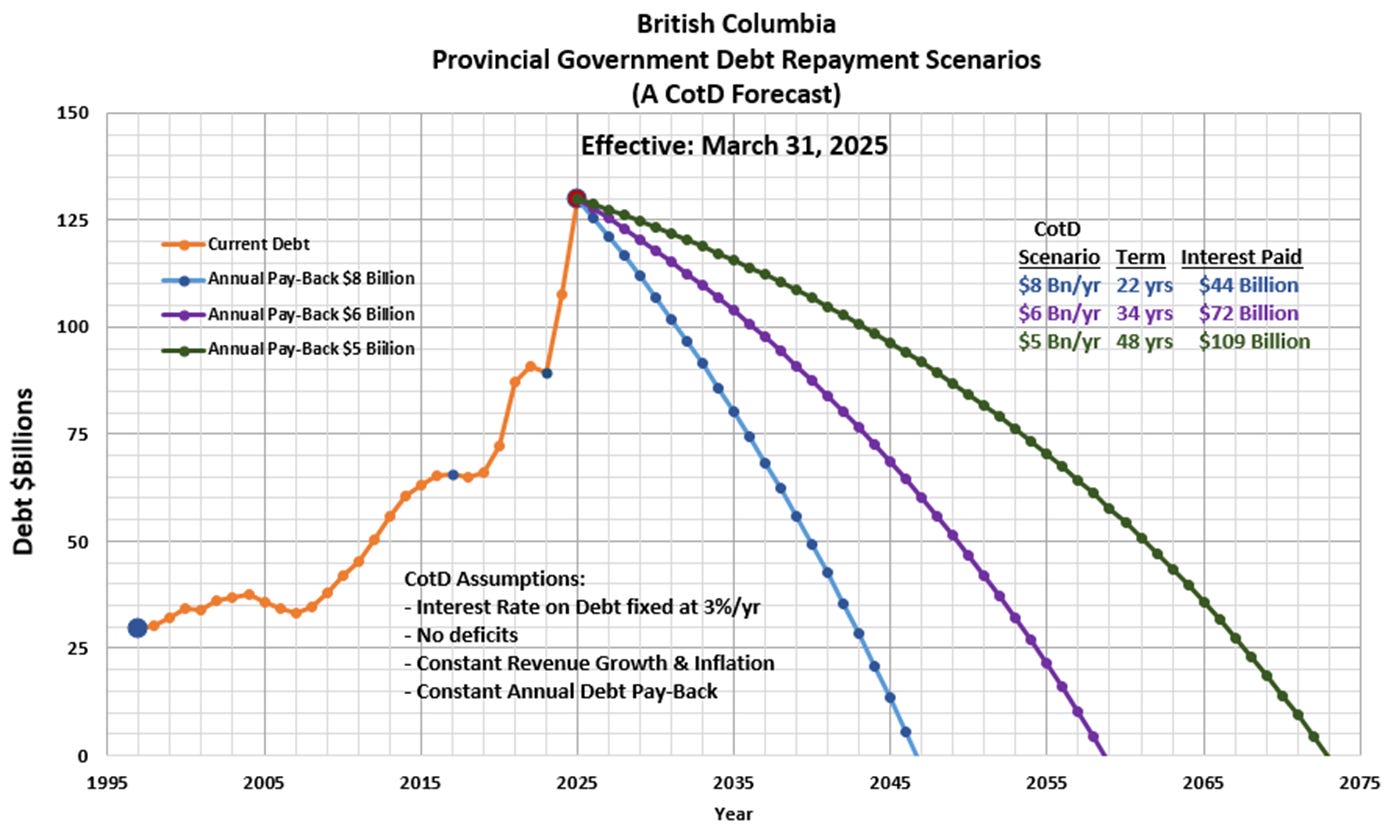
The following chart is a construct of the CotD author (food for thought). In some ideal world far, far away, this graph presents debt pay-back scenarios incorporating some basic assumptions as shown on the graph. The bottom-line…it will take somewhere between 25 to 50 years to pay-off the provincial debt while paying interest charges ranging from $44 Billion to $109 Billion in the process. The question is “which scenario would be the most likely…or none of these?”

“The last official act of any government is to loot the treasury” George Washington
“Every lie we tell incurs a debt to the truth…sooner or later that debt is paid” Valery Legasov


As far as “solutions” to the global debt situation are concerned, we need to start by recognizing that virtually every Province, every State, every Nation, in the developed, and underdeveloped world, has a gigantic debt that can never be paid.
The first rule of problem solving is to correctly identify the problem. And this is where effective problem solving usually breaks down. The problem is not correctly identified.
The problem is Usury, which means loaning money and charging interest.
What does the Holy Bible say about usury?
Exodus 22:25 says, “If you lend money to one of my people among you who is needy, do not treat it like a business deal; charge no interest”.
Leviticus 36: Take no interest from (your brother) or profit, but fear your God, that your brother may live beside you.
Most importantly in John 2:15: Jesus made a whip out of small cords when he flipped over the money tables, and drove the money changers out of the temple.
The problem our World has today is the money changers, in the form of the Global Central Banking Cartel.
The problem is not that the people are being taxed insufficiently, and we need more tax money from them in order to pay all of the Usury. That is a good example of incorrectly, identifying the problem.
So the short answer in terms of “solutions”is for every Nation, and every Province, and every State, is to flip over the tables of the money changers.
The Global Central Banking Cartel must be evicted on a global scale. And as far as money being owed is concerned, nobody owes the Central Banking Cartel a penny. It is the Central banking cartel that must make financial restitution to the Nations it has plundered.
And each nation must start printing its own money, with no usury (interest) involved.