by Eldric Vero
February 6, 2025
The following articles are relevant to this CotD:
1) Statistics Canada The Daily December 4, 2024 “Deaths, 2023” (see link: https://www150.statcan.gc.ca/n1/daily-quotidien/241204/dq241204a-eng.htm ). From the article: “There were 326,571 total deaths in Canada in 2023, a 2.4% decrease from 2022…cancer remained the leading cause of death among Canadians in 2023. There were 84,629 cancer-related deaths, representing just over one in four deaths (25.9%). Among people aged 1 to 14 years, accidents, cancers as well as congenital malformations, deformation and chromosomal abnormalities were the top three leading causes of death. The cause of death category “ill-defined and unspecified causes of mortality” is used when the underlying cause of death is undetermined or unknown. Deaths are assigned to this category when: the investigation failed to conclusively establish a specific cause of death i.e., the medical certificate of cause of death indicates “undetermined,” or the causes of death indicated on the medical certificate of cause of death lack detail, for example, cardiac arrest or the death is pending investigation by a coroner or medical examiner (e.g., deaths from accidents, suicides and homicides).
2) Denis’s Substack via Denis Rancourt December 7, 2024 “Did the C19 vaccine kill 17 million? Yes, but how? Not what you think!” (see link: https://denisrancourt.substack.com/p/did-the-c19-vaccine-kill-17-million ). As per Denis Rancourt: Essentially no excess mortality occurred anywhere in the world prior to the World Heath Organization’s 11 March 2020 arbitrary declaration of a pandemic. All excess mortality, vaccine induced or not, has been politically driven. As I have concluded in several venues: The declared Covid pandemic (2020-2023) was entirely caused by the coordinated and largescale mandates, measures, so-called responses, and medical assaults including testing, diagnostic bias, isolation, denial of treatment (especially antibiotics for pneumonia), mechanical ventilation, sedation, experimental and improper treatments, and vaccination.
The author of the CotD has combined analyses of Covid-19 and Excess Deaths (all causes) as these are related.
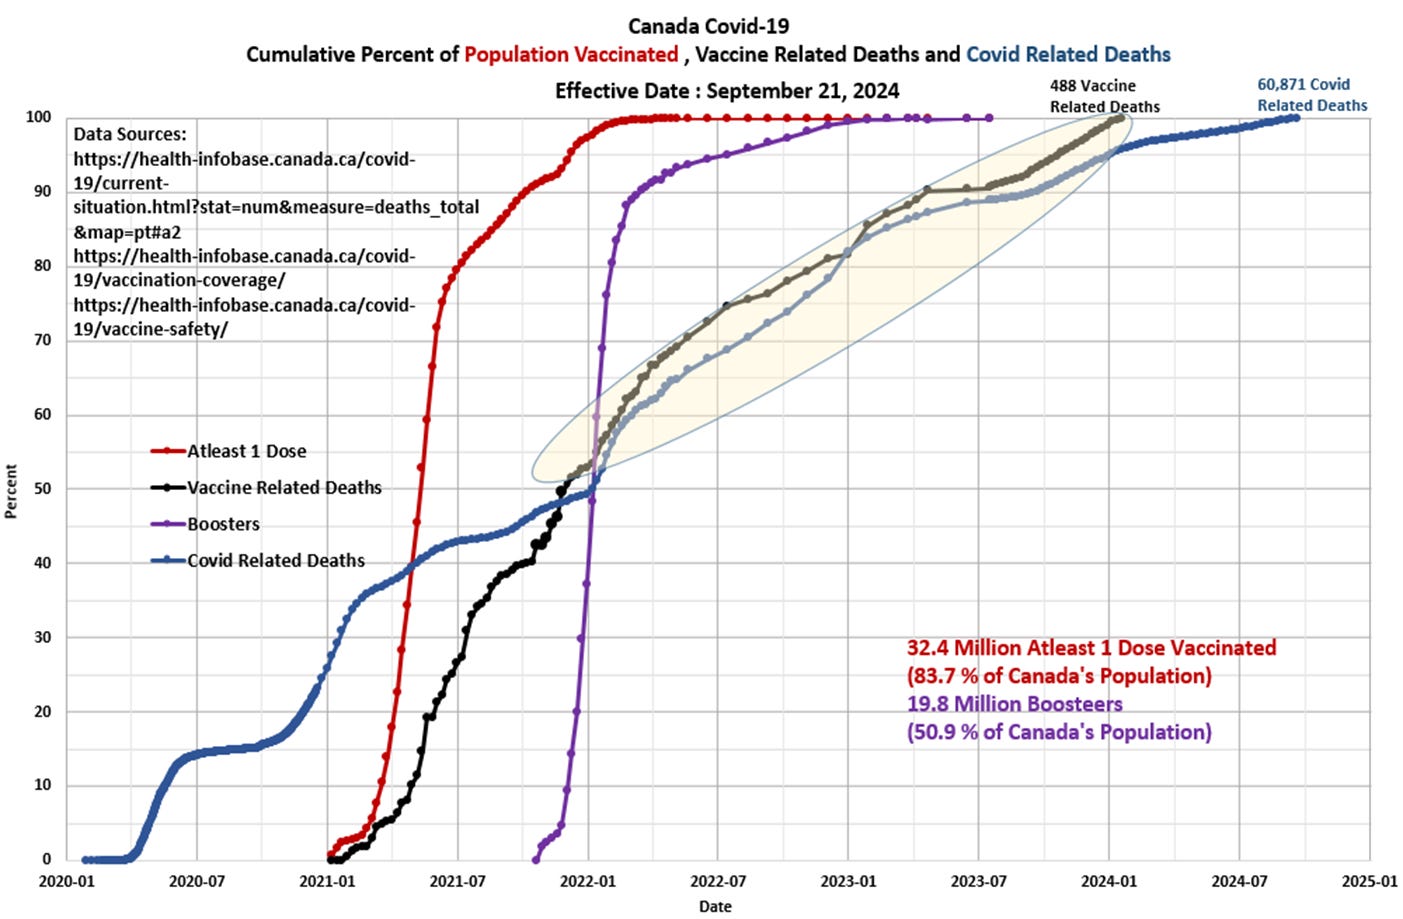
Panel 1 The first graph is a construct by the author as a standard CotD presentation which illustrates Covid-19 Related Deaths (CRDs), Vaccine Related Deaths (VRDs) and vaccinations. Health Canada has not updated the vaccination database since July 12, 2024 and the Vaccine Adverse Events since January 19, 2024. Canada’s vaccination program was initiated in December 2020 and began to accelerate into the spring/summer of 2021. The Booster program ramped-up significantly in December 2021 and continued with high booster up-take by summer 2022. The near 100 percent correlation in the “rates” of CRDs and VRDs since November 2021 (highlighted yellow) is stunning and disturbing. A total of 23,237 CRDs have occurred since April 2022 of which an estimated 19,751 CRDs (85 percent average) are vaccinated citizens (based on the Outcomes by Vaccination Status via the Health Canada Epidemiology Reports (see Panel 4 in the April 25, 2023 CotD Canada Covid-19 Death Rates https://eldric.substack.com/p/chart-of-the-day-cotd-canada-covid?utm_source=publication-search ). Health Canada ceased publishing Covid-19 Epidemiology update reports since 2022. Remember, as per Health Canada: “Evidence indicates that vaccines and boosters are effective at helping to prevent serious illness, hospitalization and death due to COVID-19. Evidence indicates that the benefits of COVID-19 vaccines continue to outweigh the risks of the disease. Receiving an mRNA booster dose provides even better protection.” Do you think the data supports these claims by Health Canada?
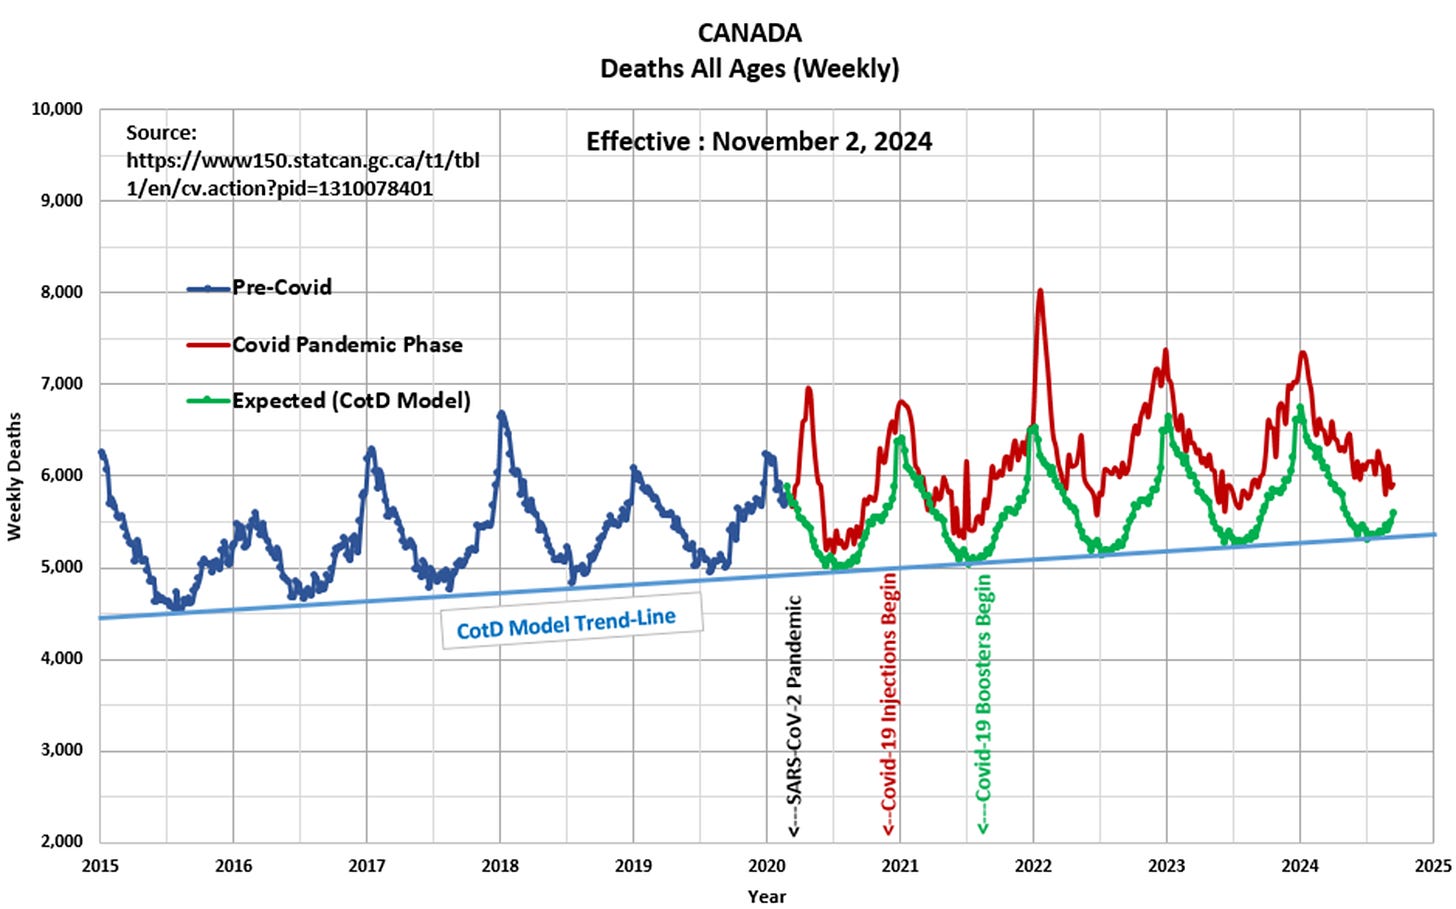
Panel 2 Observe the characteristic cyclical nature of deaths or all-cause mortality since 2015. The “Blue” line represents data prior to March 2020 and the “Red” line represents data since the SARS CoV-2 pandemic was initiated in March 2020. The “Green” line represents the “Expected” deaths (CotD Model) based on historical averages. The author has utilized the data for the five year period January 2015 to December 2019 in order to calculate an average normalized curve for Monthly Deaths. The Expected Deaths (CotD Model) incorporates an average Trend-Line slope of 1.9 percent per year which appears to be a good match to the overall pre-pandemic trend.
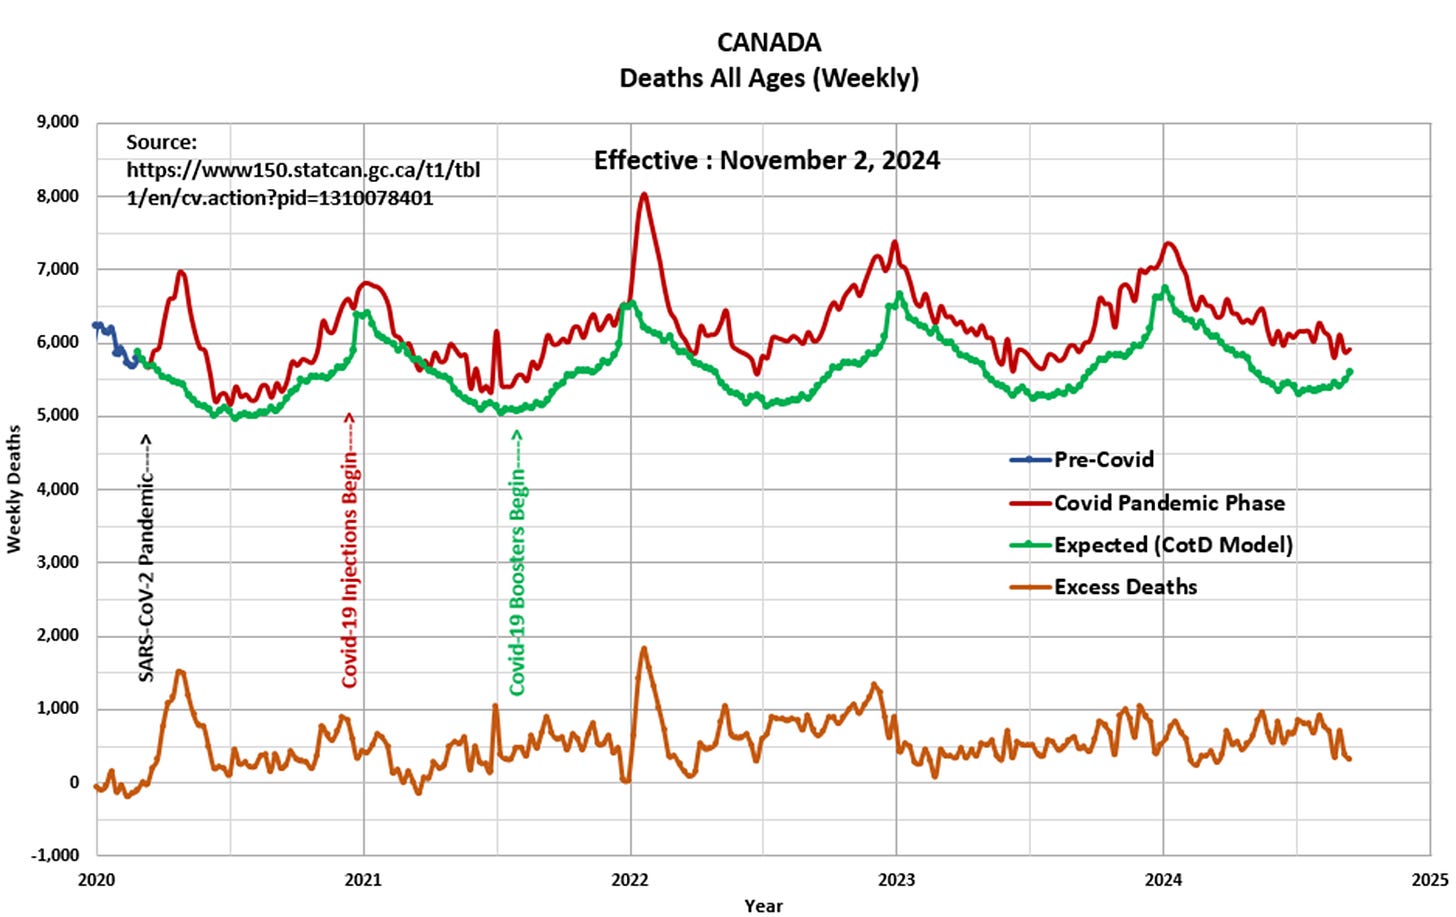
Panel 3 This presents the magnified portion (January 2020 to November 2024) of the graph in Panel 2. The “Orange” line represents “Excess Deaths” which is calculated by subtracting Expected Deaths from Official Deaths. Note the data is current to September 14, 2024.
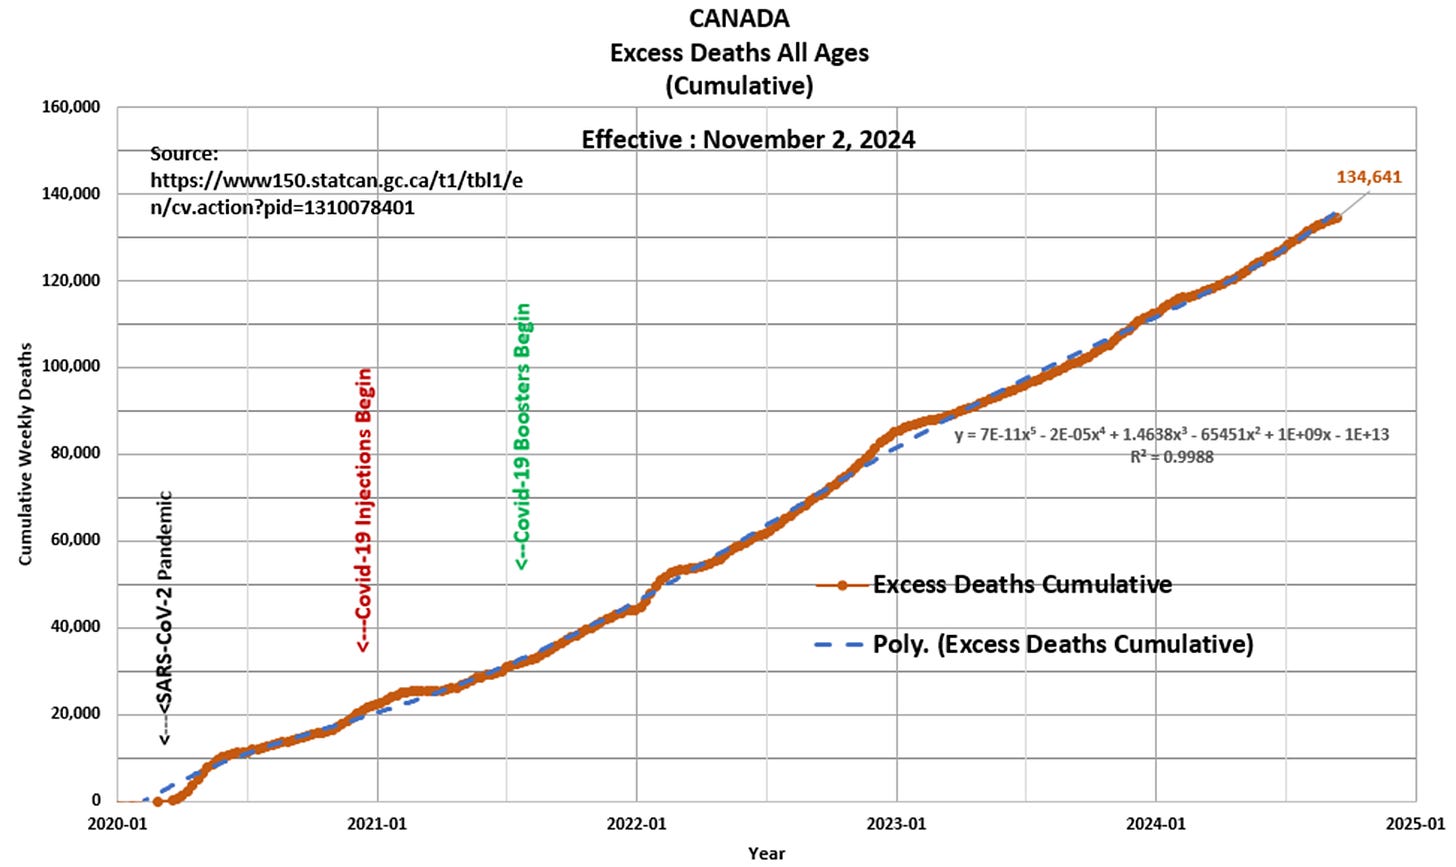
Panel 4 Based on the data and this author’s model, 134,641 Excess Deaths have occurred since the start of the pandemic of which 113,717 (84 percent) have occurred since the start of Covid-19 injections in December 2020. Note the blue-dashed curve is a polynomial (non-linear) best-fit to the data up-trend. In essence, this reveals that the Excess Death Rate (EDR) is accelerating with time, which is a strong signal something is abnormal within Canada’s population. Once again, the question is “why is this occurring?
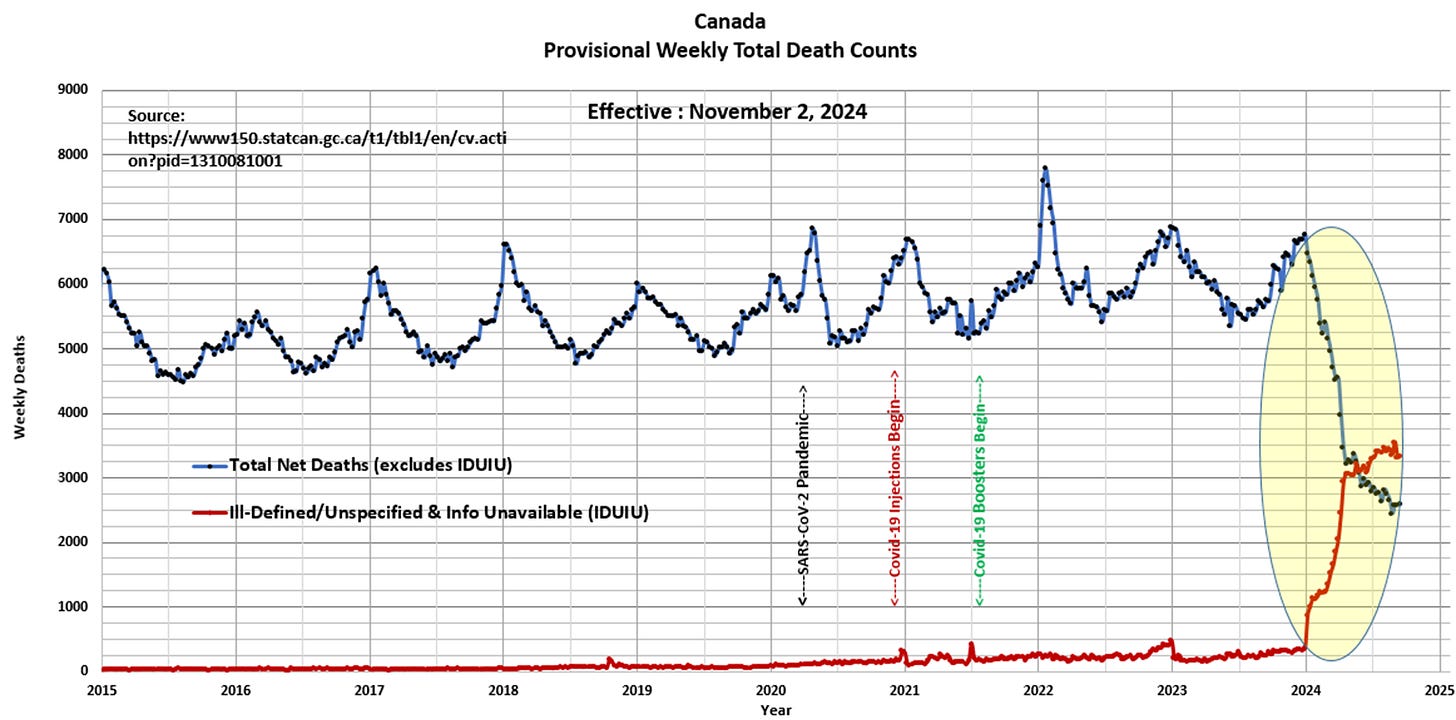
Panel 5 The following table presents the Cause of Death categories as per Statistics Canada : https://www150.statcan.gc.ca/t1/tbl1/en/cv.action?pid=1310081001. Utilizing data within the Statistics Canada website, a summary table was created depicting two recent periods for comparison purposes (March 15, 2020 to December 31, 2023 and January 1 to September 14, 2024). The majority of the categories have been in the database for many years (since 2010) with the exception of two recent categories, namely, “COVID-19” and “Information Unavailable”. The “Information Unavailable” (InfoUn) category had no data (i.e. deaths) prior to January 1, 2020. For the period March 15, 2020 to December 31, 2023, the InfoUn category averaged about 43 deaths per week, which is unusual in itself, as medical doctors, examiners and coroners are required to define a Cause of Death. Note the eye-popping change to InfoUn deaths to 2,294 per week (5,321 percent increase) during 2024. Also note the negative Percent Change to essentially all of the categories to offset the massive positive change in InfoUn and Ill-Def Unspef deaths. As an aside, homicides in Canada have averaged 15.5 per week for the four year period ending December 31, 2023. As there is no specific homicide category within the database, homicides are likely captured in the All Other cause of death category.

Panel 6 The author of the CotD was shocked by this dataset presentation as it relates to Ill-Defined/Unspecified (IDU) and Information Unavailable (IU) deaths. Since mid-July 2024, the combined categories of InfoUn plus Ill-Def/Unspef have averaged in the order of 3,400 per week representing 56 percent of Total Deaths. Note the InfoUn death category was initiated in early 2020 (coincidentally at the start of the pandemic). Is this one of the smoking guns?
“An ancestor of mine maintained that when you eliminate the impossible, whatever remains, however improbable, must be the truth.” Spock Star Trek VI The Undiscovered Country

