by Eldric Vero
August 7, 2023
This is a presentation of the Government of Canada historical deficits and debts.
Panel 1
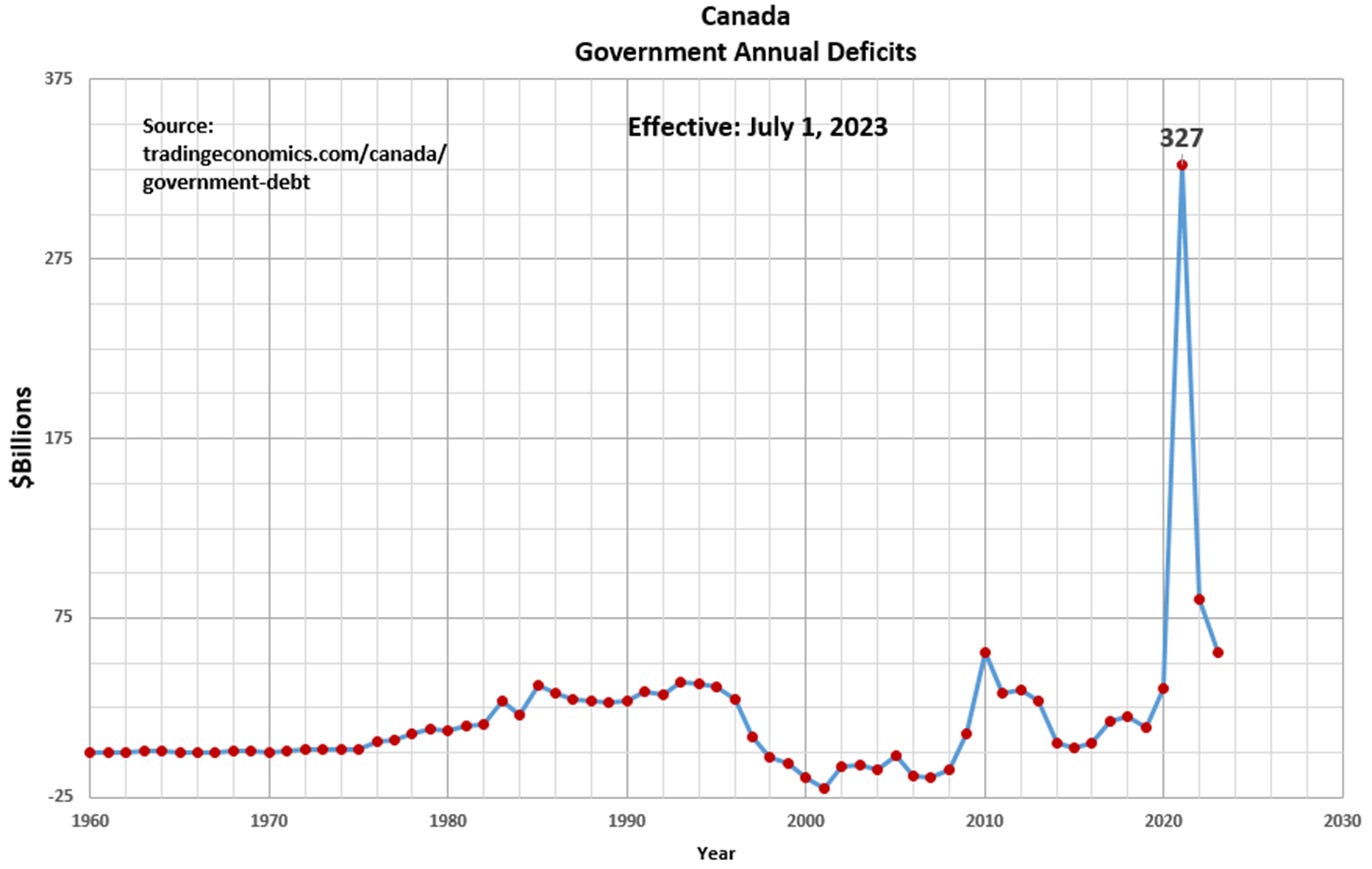
This graph presents the government of Canada annual deficits contributing to the overall cumulative debt. Note the extreme deficit of $327 billion in 2021 alone which is over 15 times the average annual deficits over the previous 10 years. This is unconscionable to say the least.
Panel 2
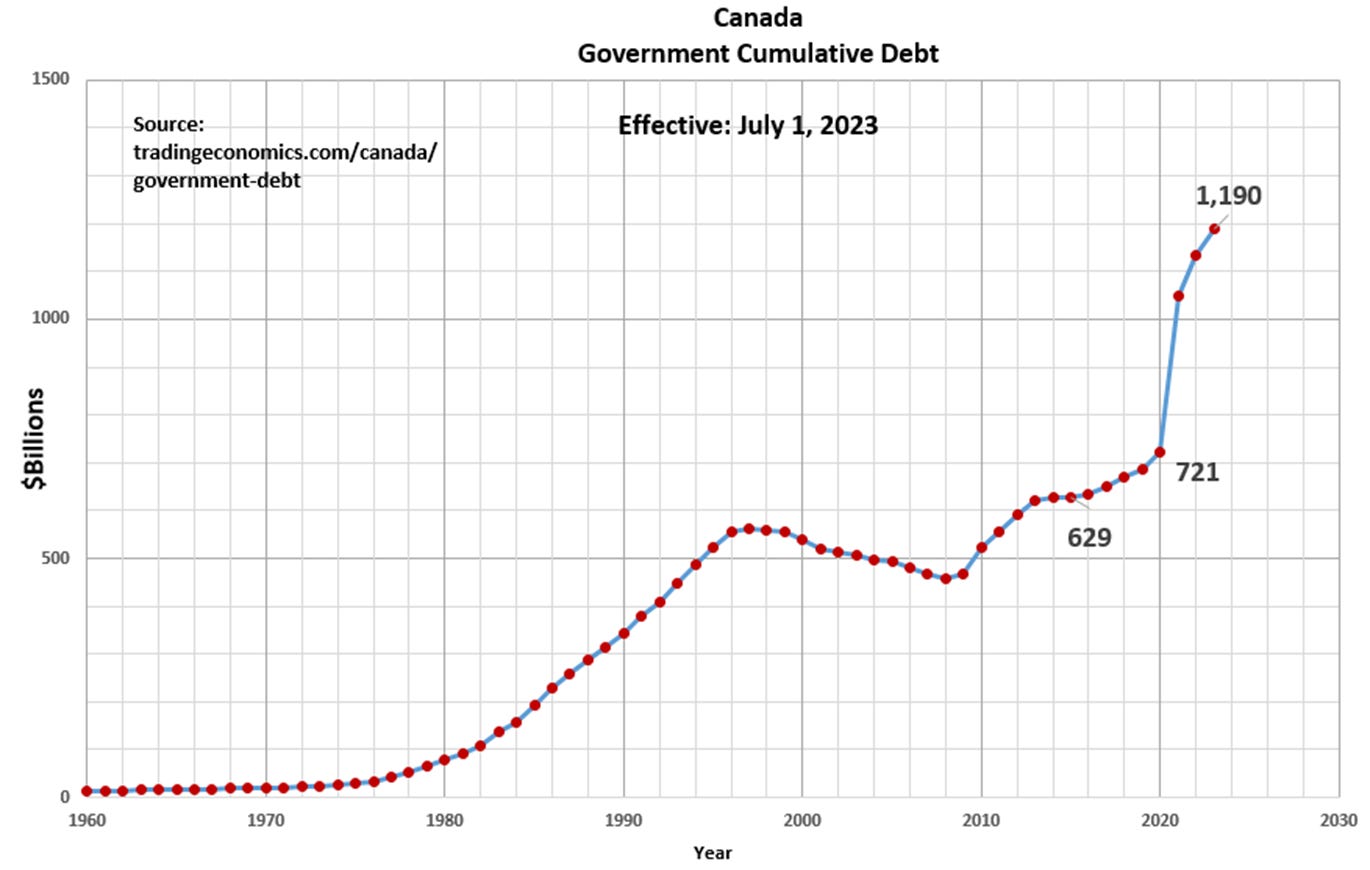
This is the graphical presentation of the government of Canada cumulative debt since 1960. Note the high level of annual deficits from 1976 to 1996 followed by relatively stable deficits (including a period of debt reduction) to 2015. Since 2015, the debt has increased by about $560 billion to July 1, 2023 and is projected by the author to be $1210 billion by year-end 2023.
Panel 3
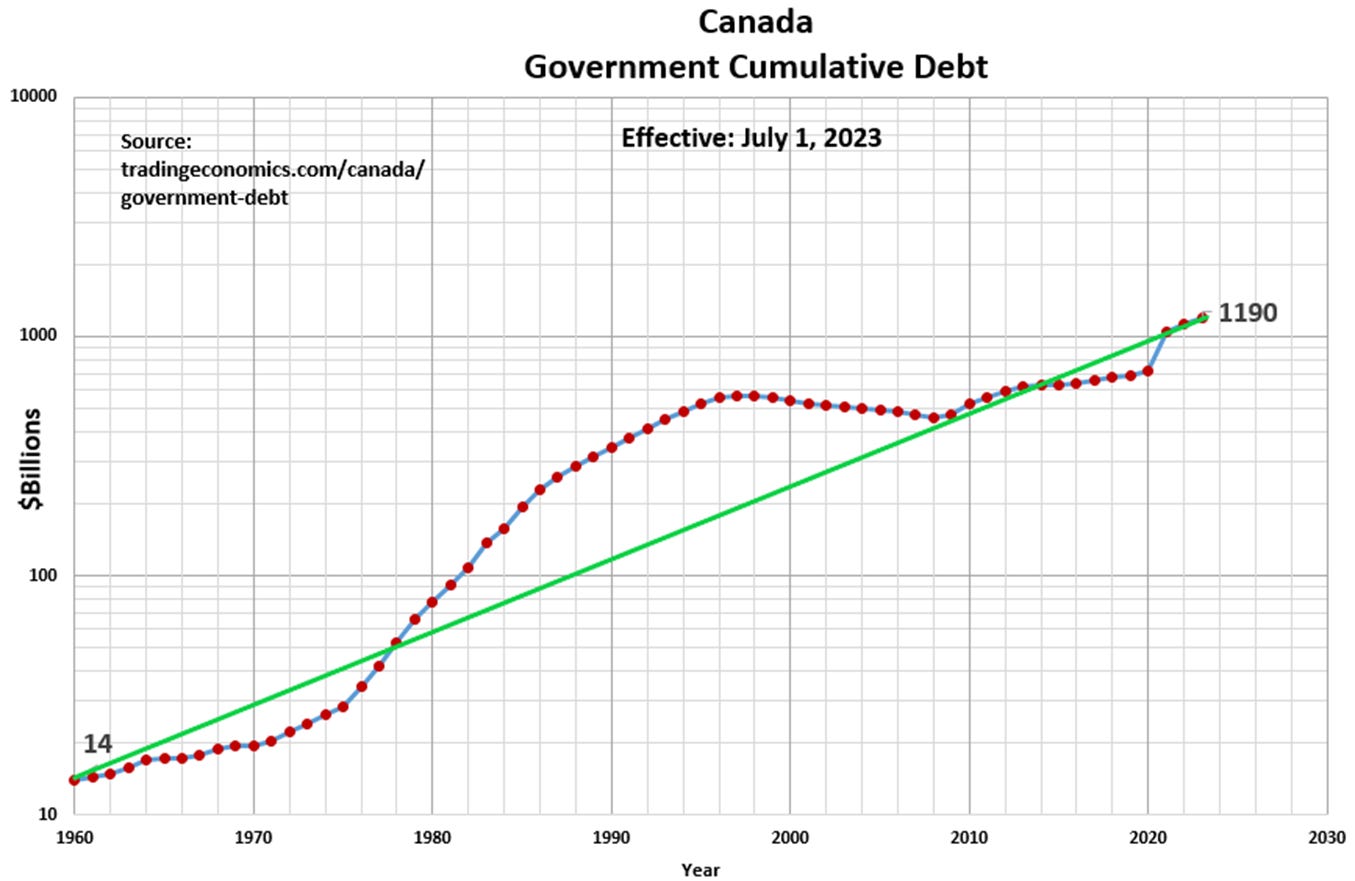
This is the same government of Canada cumulative debt since 1960 presented on a semi-logarithmic plot. The green line represents an average debt increase of 7.3 percent per year.
Panel 4
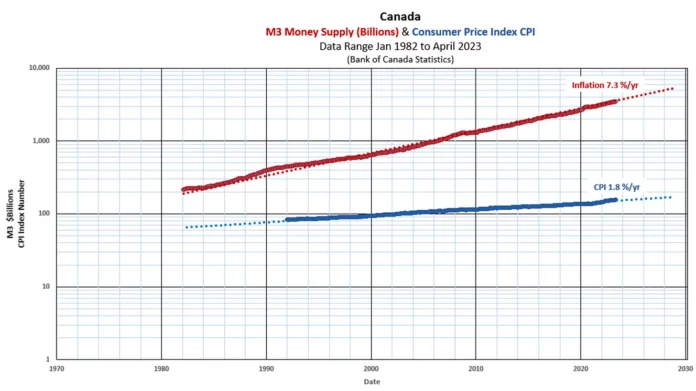
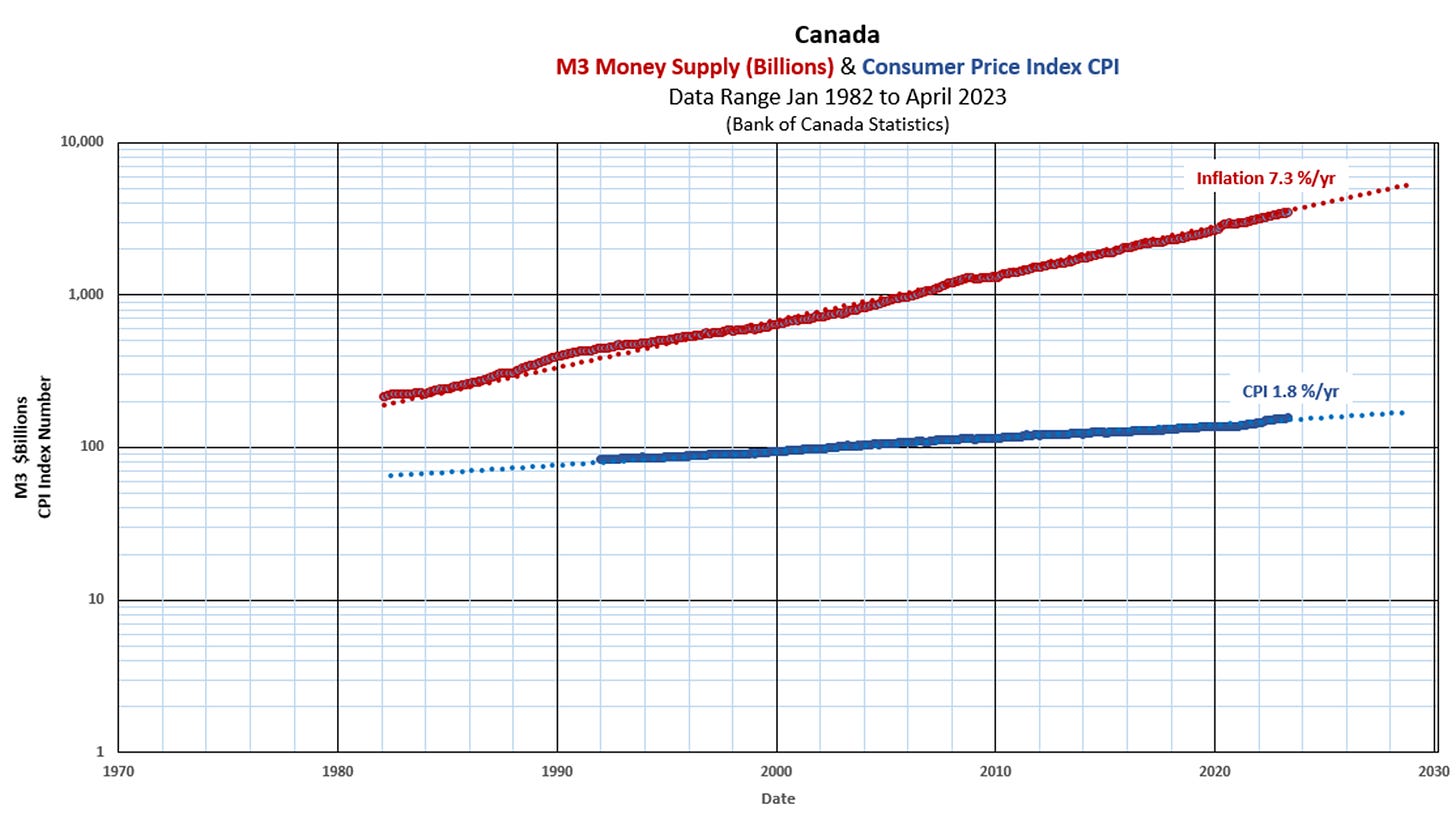
This graph was presented in the June 20, 2023 CotD. The source of inflation is from a country’s central bank, in this case, the Bank of Canada (BoC) and M3 Money Supply. The “Selected Monetary Aggregates and their Components” can be accessed via the BoC website: https://www.bankofcanada.ca/rates/banking-and-financial-statistics/selected-monetary-aggregates-and-their-components-formerly-e1/#table. Note the parallel nature of monetary Inflation via the BoC and the government of Canada’s cumulative debt above – both have averaged 7.3 percent per year over the long-term.
“The last official act of any government is to loot the treasury” George Washington
“No one is more hated than he who speaks the truth” Plato


