by Eldric Vero
July 4, 2025
This CotD was inspired by two recent articles:
1) Dr. William Makis Substack “NEW PODCAST! “15 minutes with Dr.Makis” – Episode 021: UCP Live Event: : “An Injection of Truth” on June 17, 2024 (Official Release)” see link:
See link:
https://makismd.substack.com/p/new-podcast-15-minutes-with-drmakis-744
From Dr. Makis’s presentation: There are very serious adverse events where kids require transplants, for example. Liver transplants, heart transplants, lung transplants. Doctors are not allowed by the colleges to tell parents about these risks. Alberta Premier Daniel Smith said, we give the choice to Alberta parents. That is incorrect. What kind of choice is it when you’re not informed about the risks as a parent? That’s not a choice. That’s not informed consent. They’re going after Dr. Eric Payne. They’re going after Dr. Gary Davidson, Dr. Dennis Modri, Dr. Daniel Negassi, Dr. Gregory Chan, and myself. They threatened my family just a few months ago at our house. So these are the corrupt institutions that want to jab your children as young as six months old, up to every three months if possible, because they’re the ones being protected by the pharmaceutical industry.
2) National Post April 24, 2024 “Danielle Smith picked ’contrarian’ doctor to lead COVID review to get ‘a broad range of perspectives’” (see link: https://nationalpost.com/news/danielle-smith-picked-contrarian-doctor-to-lead-covid-review-to-get-a-broad-range-of-perspectives ). From the article: Alberta Premier Danielle Smith says it’s a good idea to have a physician who accused the province of exaggerating COVID-19’s impact on hospitals now lead a review of pandemic-era health data. Smith says Dr. Gary Davidson was selected to lead the data review because she wants to hear a range of viewpoints, including from those “shouted down in the public sphere. During the height of the fourth wave of the pandemic in 2021, Davidson claimed hospital admission numbers were overblown and being manipulated to justify public health restrictions. The provincial health authority, Alberta Health Services, rejected those accusations as false.
The author of the CotD has combined analyses of Covid-19 and Excess Deaths (all causes) as these are related.
Panel 1 The first graph is a construct by the author as a standard CotD presentation which illustrates Covid-19 Related Deaths (CRDs) and vaccinations. Alberta’s vaccination program was initiated in January 2021 and began to accelerate into the spring/summer of 2021. There appeared to be some success to vaccination by Q3’2021 as the CRD rate decreased somewhat with approximately 70 percent of the population fully vaccinated. The Booster program ramped-up significantly in Q4’2021 and continued with high booster up-take rates into Spring 2022. Note the significant increase in the CRD rate (highlighted yellow) coincident to the Booster injections which is perplexing and disturbing. Remember, as per Health Canada : “Evidence indicates that vaccines and boosters are effective at helping to prevent serious illness, hospitalization and death due to COVID-19. Evidence indicates that the benefits of COVID-19 vaccines continue to outweigh the risks of the disease. Receiving an mRNA booster dose provides even better protection.” Do you think the data supports these claims by Health Canada?

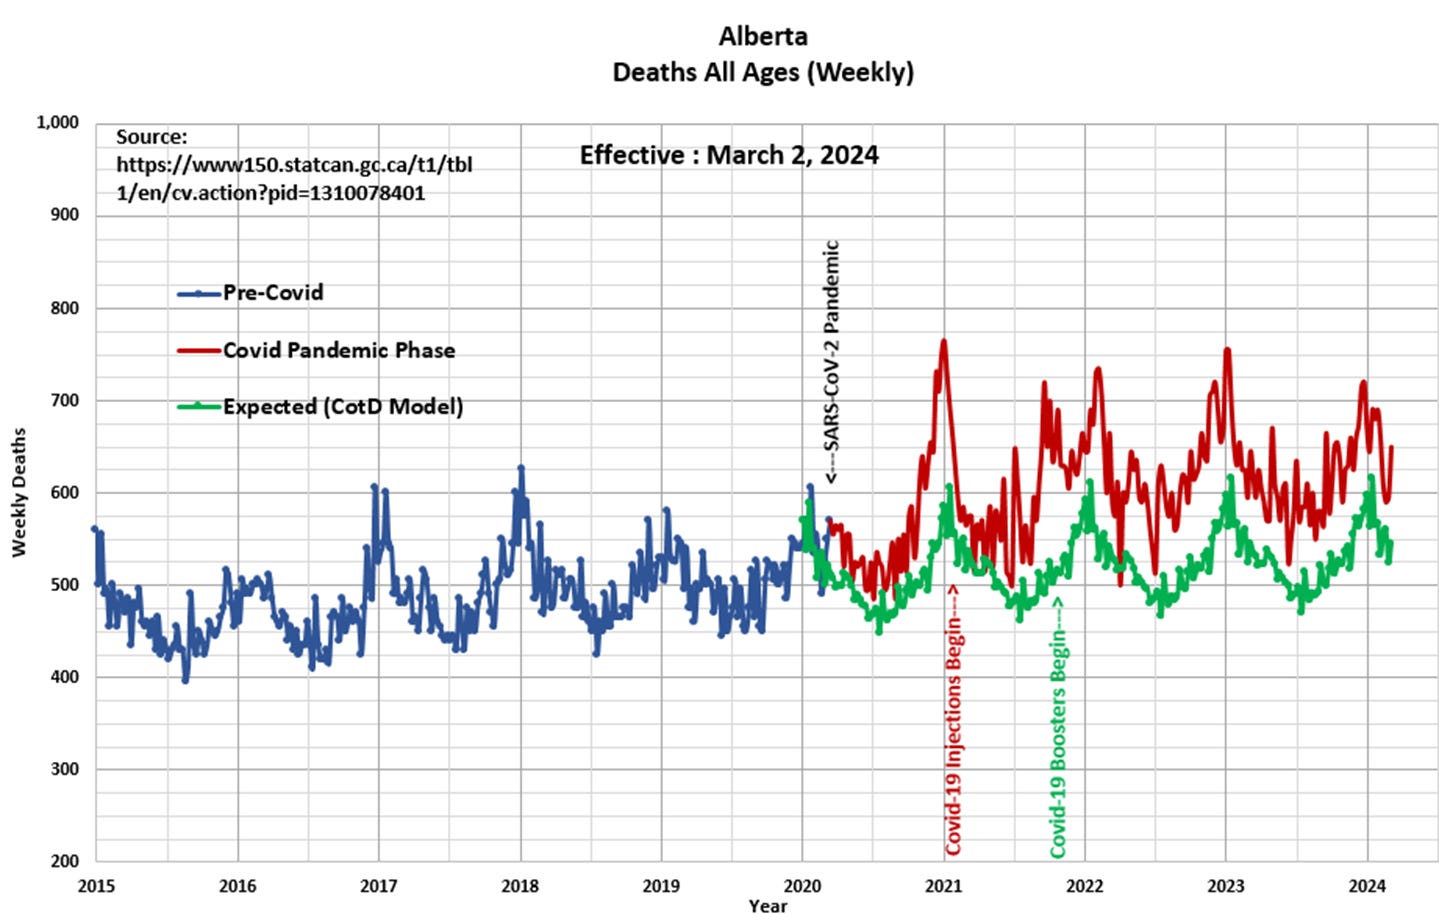
Panel 2 Observe the characteristic cyclical nature of deaths or all-cause mortality since 2015. The “Blue” line represents data prior to March 2020 and the “Red” line represents data since the SARS CoV-2 pandemic was initiated in March 2020. The “Green” line represents the “Expected” deaths (CotD Model) based on historical averages. The author has utilized the data for the five year period January 2015 to December 2019 in order to calculate an average normalized curve for Monthly Deaths. The Expected Deaths (CotD Model) incorporates an average 7.0 percent growth factor (the highest rate the CotD has encountered) which appears to be a good match to the overall pre-pandemic trend.

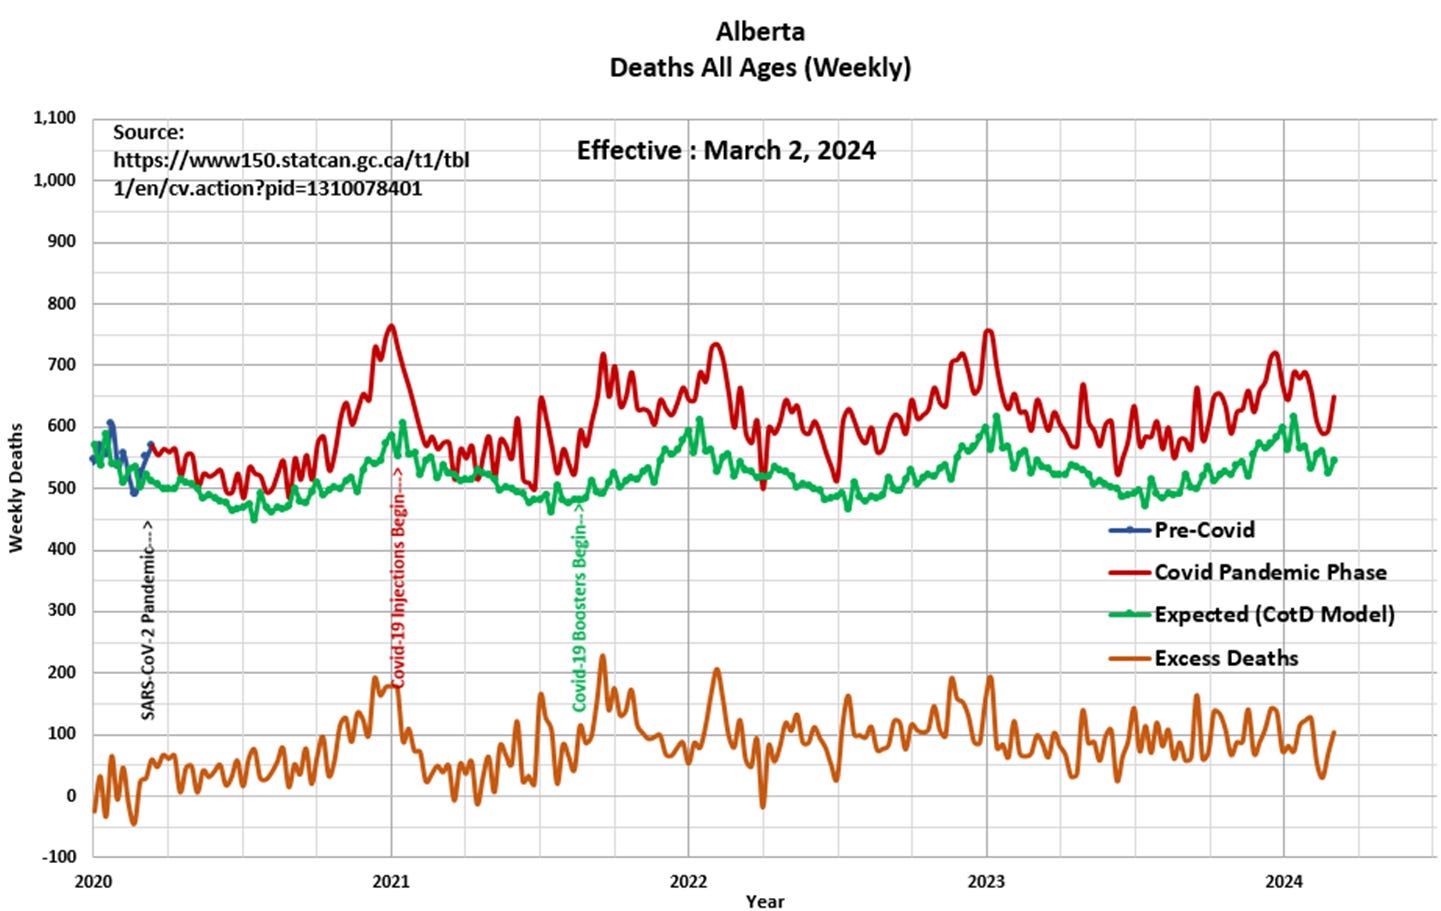
Panel 3 This presents the magnified portion (January 2020 to March 2024) of the graph in Panel 2. The “Orange” line represents “Excess Deaths” which is calculated by subtracting Expected Deaths from Official Deaths.

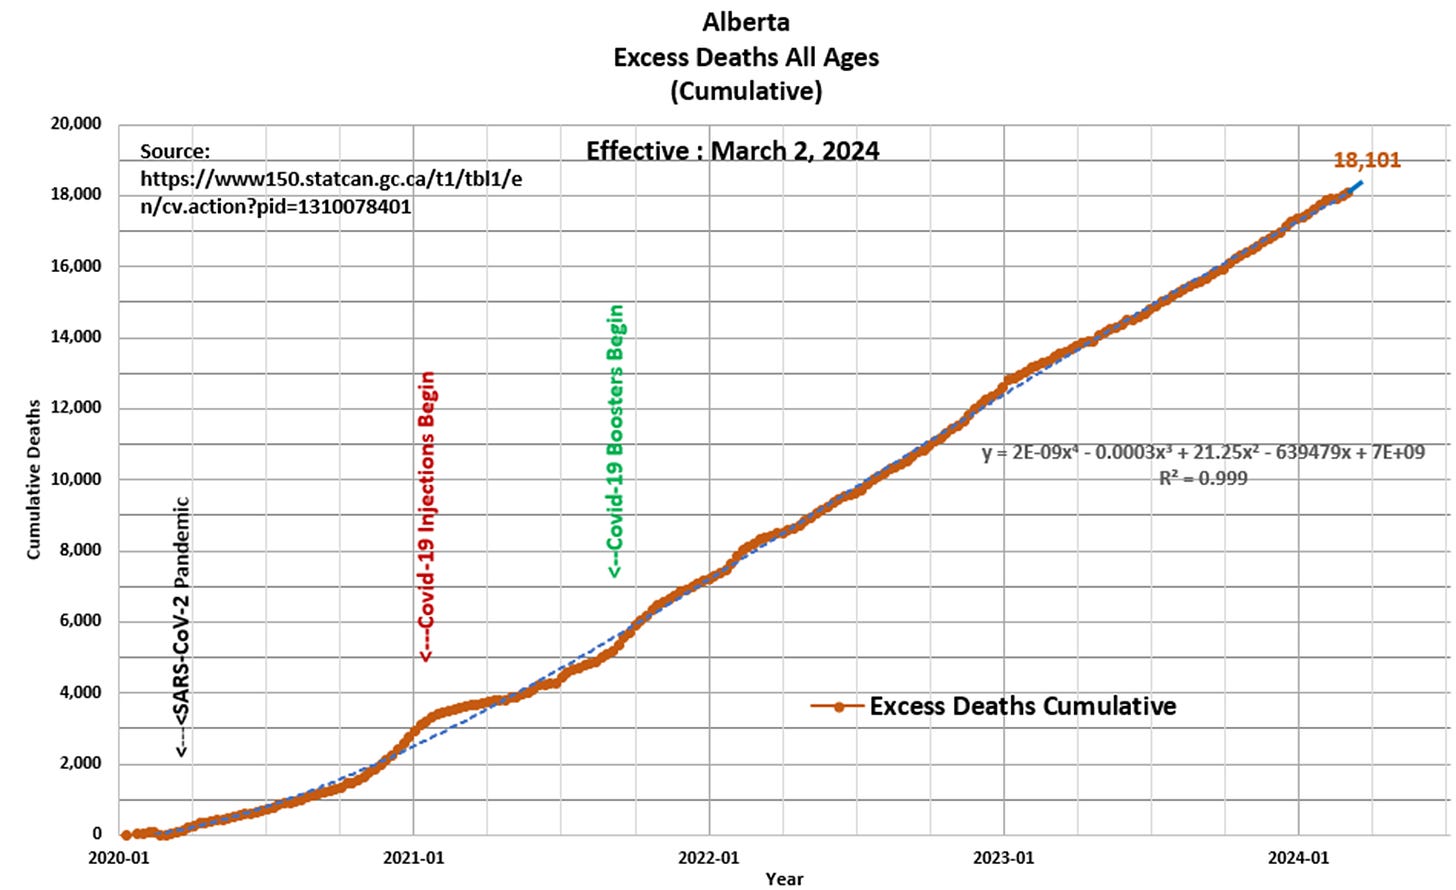
Panel 4 Based on the data and this author’s model, 18,101 Excess Deaths have occurred since the start of the pandemic of which 15,161 (84 percent) have occurred since the start of Covid-19 injections in January 2021. This compares to an estimated 15,115 Excess Deaths since January 2021 as per the Statistic Canada website (the Statistics Canada database is current to Sept. 2, 2023). The blue-dashed curve is a polynomial (non-linear) best-fit to the data up-trend. In essence, this reveals that the Excess Death Rate (EDR) is at an elevated deviated phase with time, which is a strong signal something is abnormal within Alberta’s population. Once again, the question is “why is this occurring?

“You can’t reason with evil, son…evil wants what it wants and won’t stop until its’ won or you kill it”. John Dutton Yellowstone (TV series)


