by Eldric Vero
August 12, 2024
The following articles are relevant to this CotD:
1) Unicef April 1, 2022 “COVID-19 vaccine caravan brings information and vaccines closer to citizens” (see link: https://www.unicef.org/northmacedonia/press-releases/covid-19-vaccine-caravan-brings-information-and-vaccines-closer-citizens ). As per the article: A large part of the population remains unprotected from possible severe illness of COVID-19. Unvaccinated people have a higher risk of death, compared to those who have been vaccinated. Therefore, citizens should not hesitate and the decision to vaccinate should not be delayed,” said Deputy Minister of Health Vladimir Rendevski. COVID-19 vaccines are proven to be safe and effective.
2) HART Group November 20, 2022 “The Injection Rejection” (see link: https://www.hartgroup.org/the-injection-rejection/ ). As per the article: In numerous countries, despite vaccination remaining available, people are no longer cooperating with the programme. Somehow, people have made a conscious or, perhaps for many a subconscious decision to decline. In Europe, these countries include Denmark, Ireland, Moldova, Cyprus, Georgia, Spain and North Macedonia.
The author of the CotD has combined analyses of Covid-19 and Excess Deaths (all causes) as these are related.
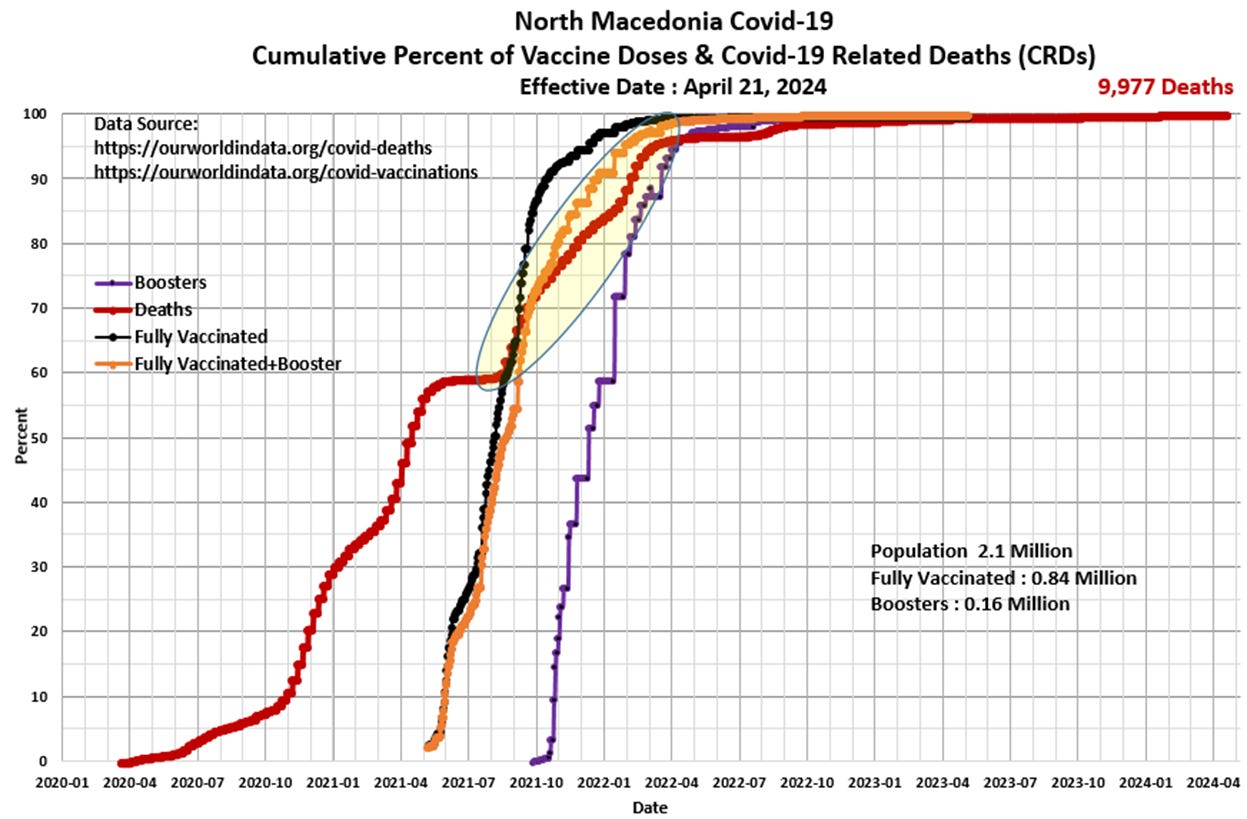
Panel 1 The first graph is a construct by the author as a standard CotD presentation which illustrates Covid-19 related deaths (CRDs) and vaccinations. The CRD rate was at a relatively low rate from the outset of the SARs-CoV-2 pandemic in March 2020, however, the CRD rate accelerated by October 2020 and continued into Q2’2021. As is fairly typical, the CRD rate subsided somewhat (nearly flat) into the summer of 2021, however, continued at a high rate into Q2’2022. The vaccination program was initiated in May 2021 with notably high injection uptake rates into Q4’2021, however, there was little to no impact on the CRD rate curve. The booster program was initiated in October 2021 with again, extremely high injection rates into Q2’2022. The vaccine-to-death correlation (shaded yellow) appears to be self-evident based on these mirror-like curves. The CRD rate has declined significantly (i.e. zero) since Q1’2023 as vaccination uptake has waned and is essentially zero. Total CRDs to date represent 0.48 percent of the population.
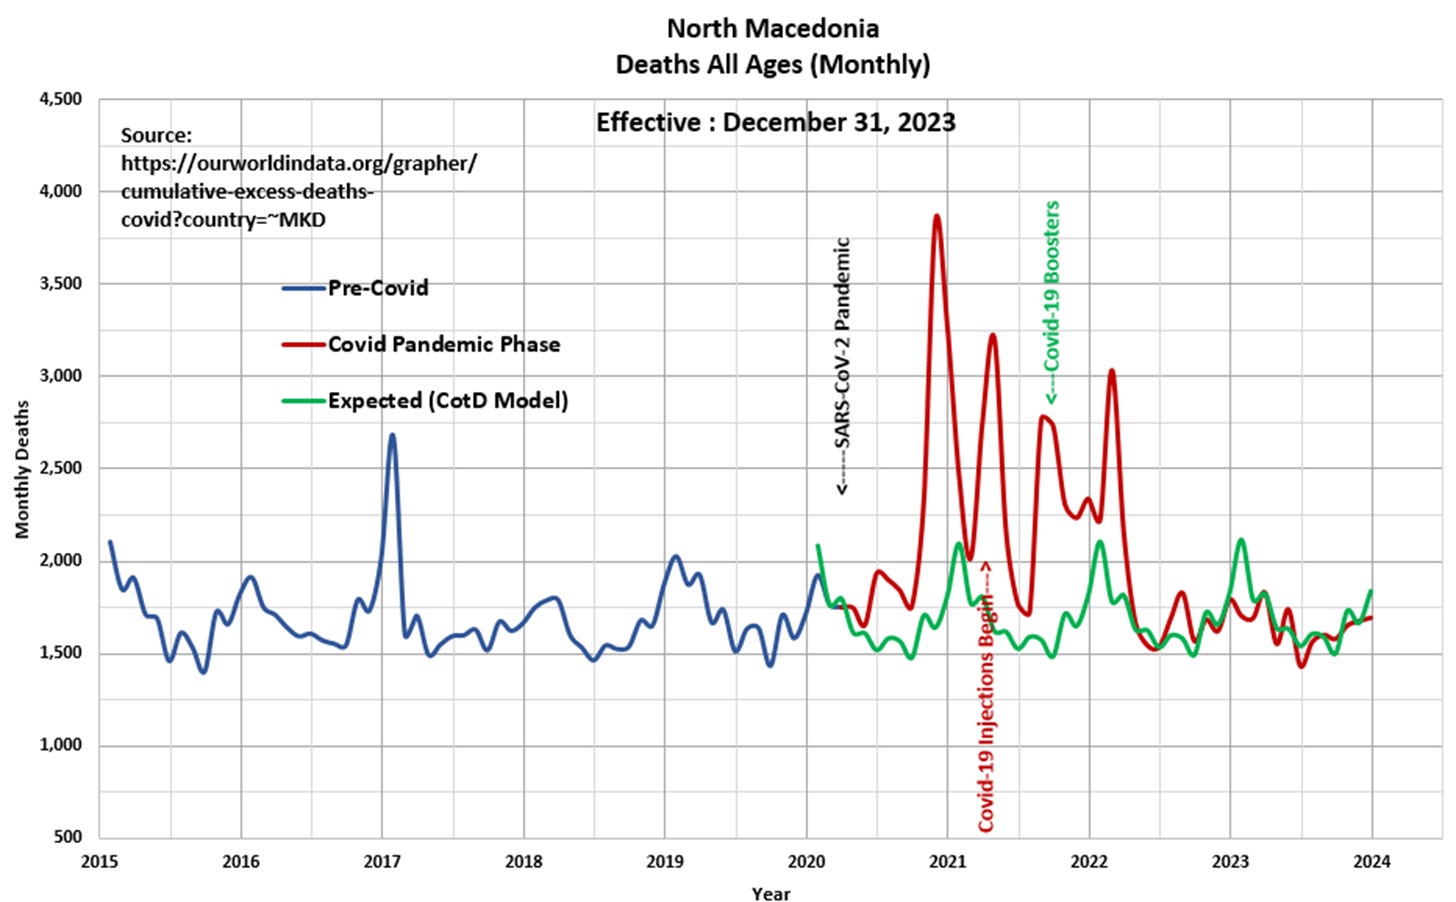
Panel 2 Observe the cyclical nature of deaths or all-cause mortality since 2015. The “Blue” line represents data prior to March 2020 and the “Red” line represents data since the SARS CoV-2 pandemic was initiated in March 2020. The “Green” line represents the “Expected” deaths (CotD Model) based on historical averages. The author has utilized the five year period January 2015 to December 2019 in order to calculate an average normalized curve for Weekly Deaths. The Expected (CotD Model) deaths incorporates an average 0.5 percent annual growth factor which appears to be a good match to the overall historical trend.
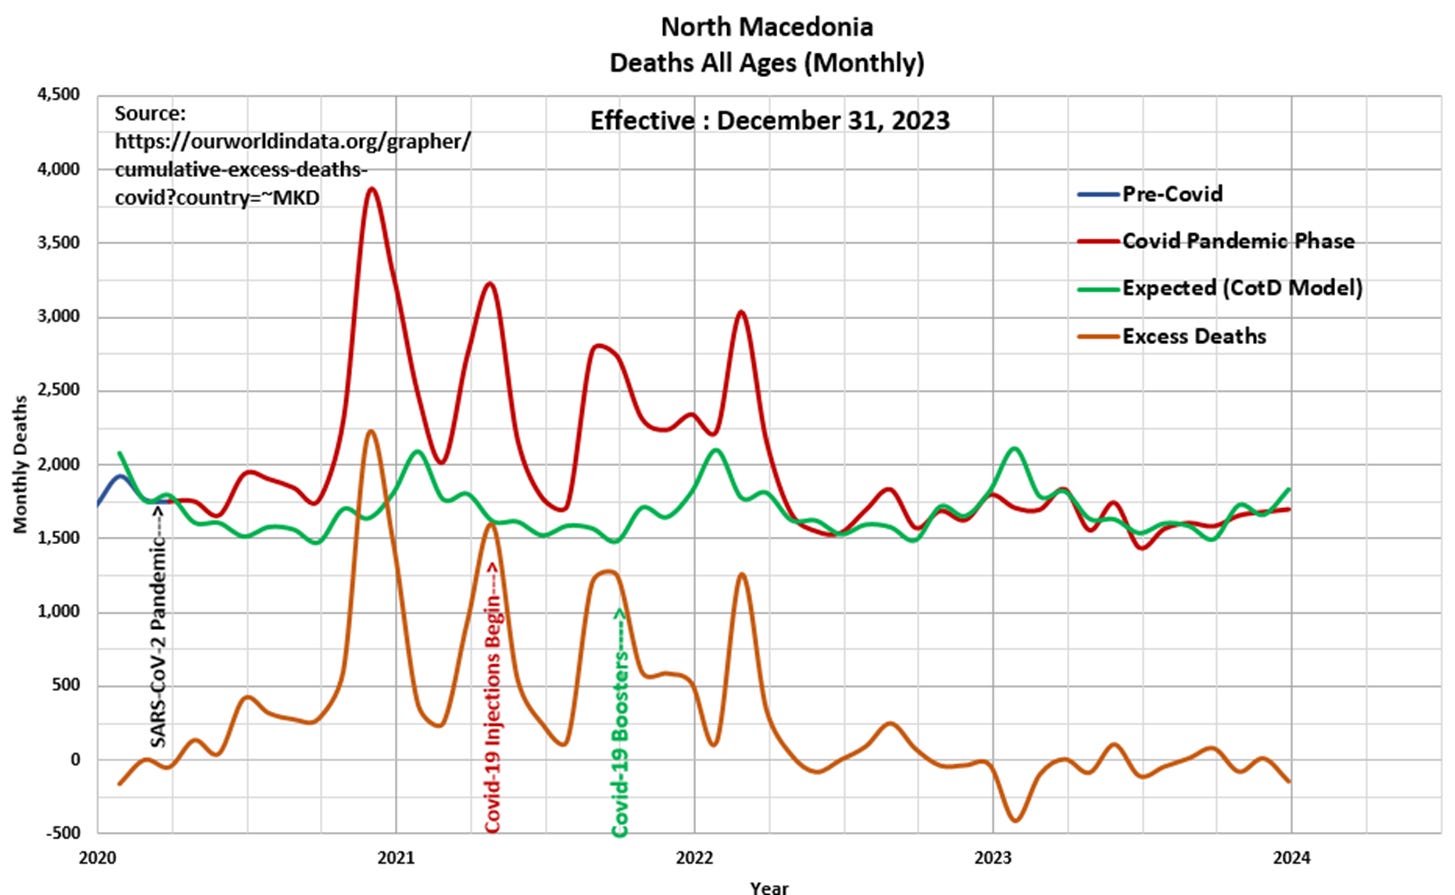
Panel 3 This presents the magnified portion (January 2020 to January 2024) of the graph in Panel 2. The “Orange” line represents “Excess Deaths” which is calculated by subtracting Expected Deaths from Official Deaths.
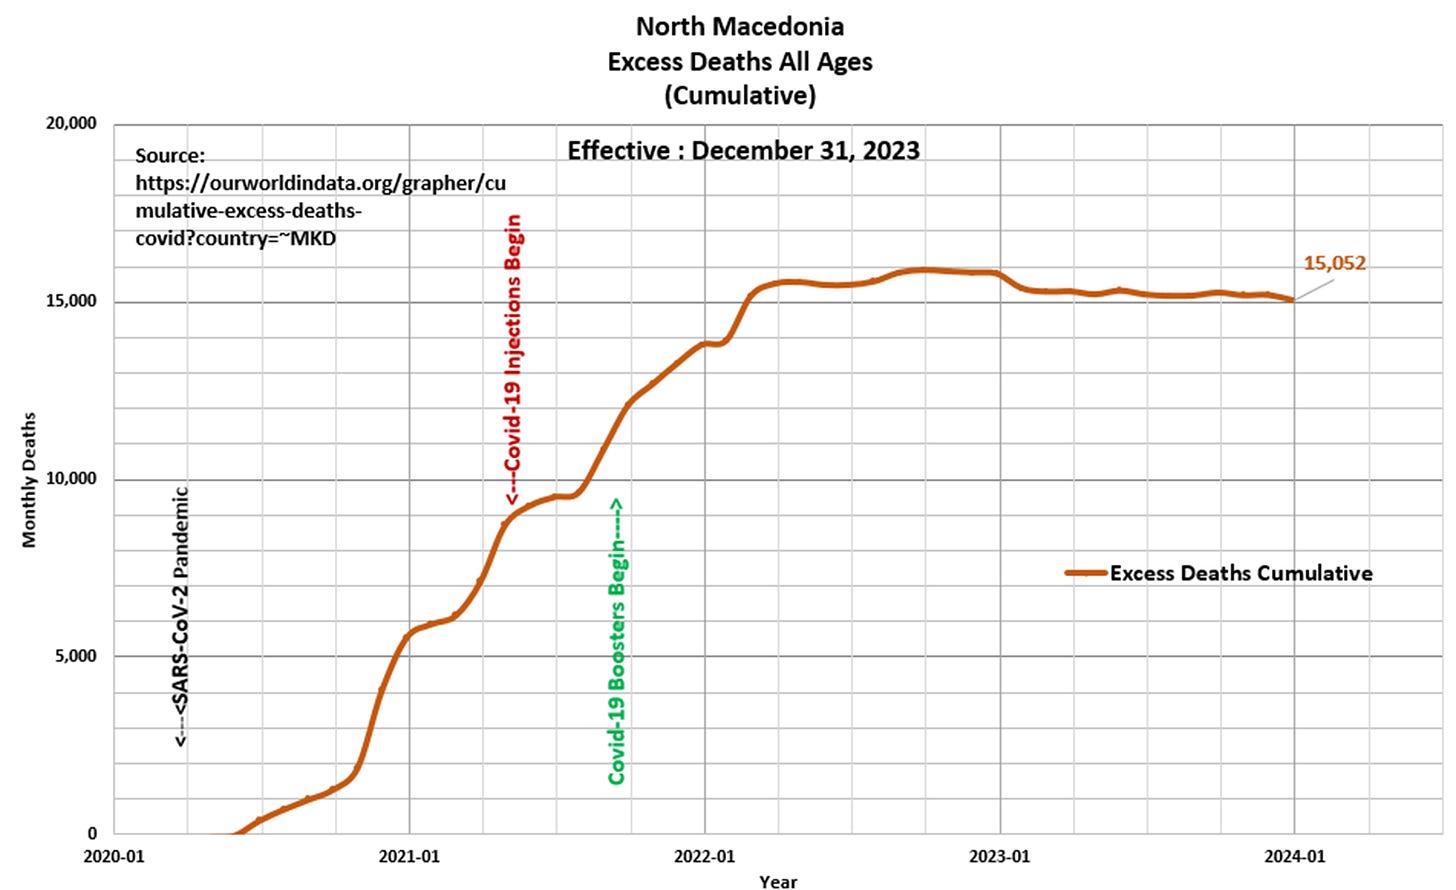
Panel 4 Based on the data and this author’s model 15,052 Excess Deaths have occurred since the start of the pandemic, of which 7,930 Excess Deaths (53 percent) have occurred since the start of Covid-19 injections in May 2021. This compares to 16,816 Excess Deaths since the start of the pandemic as per the ourworldindata.org website.
“Be a free thinker and don’t accept everything you hear as truth. Be critical and evaluate what you believe in.” Aristotle


