by Eldric Vero
August 14, 2024
The following articles are relevant to this CotD:
1) The Expose News February 18, 2022 “Public Health Scotland will no longer publish Covid-19 Data because it shows the Fully Vaccinated are developing AIDS” (see link: https://expose-news.com/2022/02/18/phs-refuse-publish-covid-data-shows-fully-vaccinated-have-aids/ ). As per the article: Public Health Scotland will stop publishing data on Covid deaths and hospitalisations by vaccination status going forward because the data has shown for the past few weeks that the fully vaccinated population are developing AIDS. The lowest immune system performance against hospitalisation was recorded in the week ending 11th Feb, hitting minus-81%. Whilst the lowest immune system performance against death was recorded in the week ending 21st Jan, hitting minus-116.48%, meaning the fully vaccinated passed the AIDS barrier.
2) The Expose News August 9, 2024 “Public Health Scotland reveals that Covid is no more deadly than seasonal flu” (see link: https://expose-news.com/2024/08/09/scotland-reveals-that-covid-is-no-more-deadly-than-seasonal-flu/ ). As per the article: A study conducted from November 2023 to March 2024 used weekly lateral flow tests for 200,000 participants in England and Scotland. It revealed that the infection fatality rate (“IFR”) for those who tested positive for covid in Scotland is 0.08%. The IFR for seasonal flu is between 0.03 and 0.1%.
The author of the CotD has combined analyses of Covid-19 and Excess Deaths (all causes) as these are related.
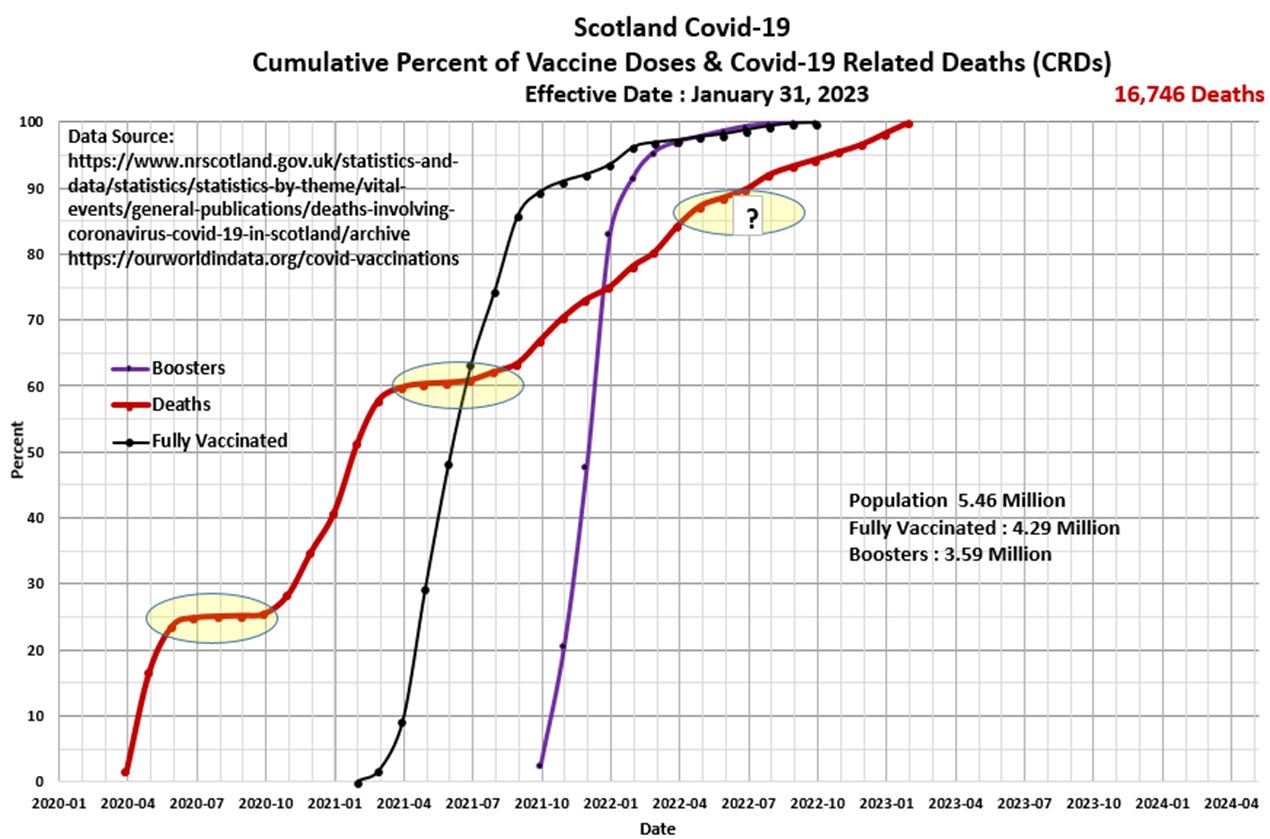
Panel 1 The first graph is a construct by the author as a standard CotD presentation which illustrates Covid-19 related deaths (CRDs) and vaccinations. Scotland’s CRD rate was extremely high immediately upon announcement of the SARS-CoV-2 pandemic in March 2020 and then “flattened” during the summer months (pre-vaccination). However, heading into the winter months of 2020/21, the CRD rate once again took-off as would be expected for a corona virus in the northern latitudes. As is fairly typical, the CRD rate subsided somewhat (nearly flat) into the summer of 2021, however, continued at a relatively high rate into Q1’2023. The vaccination program was initiated in January 2021 with notably high injection uptake rates into Q4’2021, however, there was little to no impact on the CRD rate curve. The booster program was initiated in October 2021 with again, extremely high injection rates into Q2’2022. Note that there was no reduction in the CRD rate approaching the summer of 2022, even-though 98 percent of the vaccines had been administered by then. The CRD rate continued to climb into January 2023, however, the CotD author could not find any data beyond that point in time. Total CRDs to date represent 0.31 percent of the population.

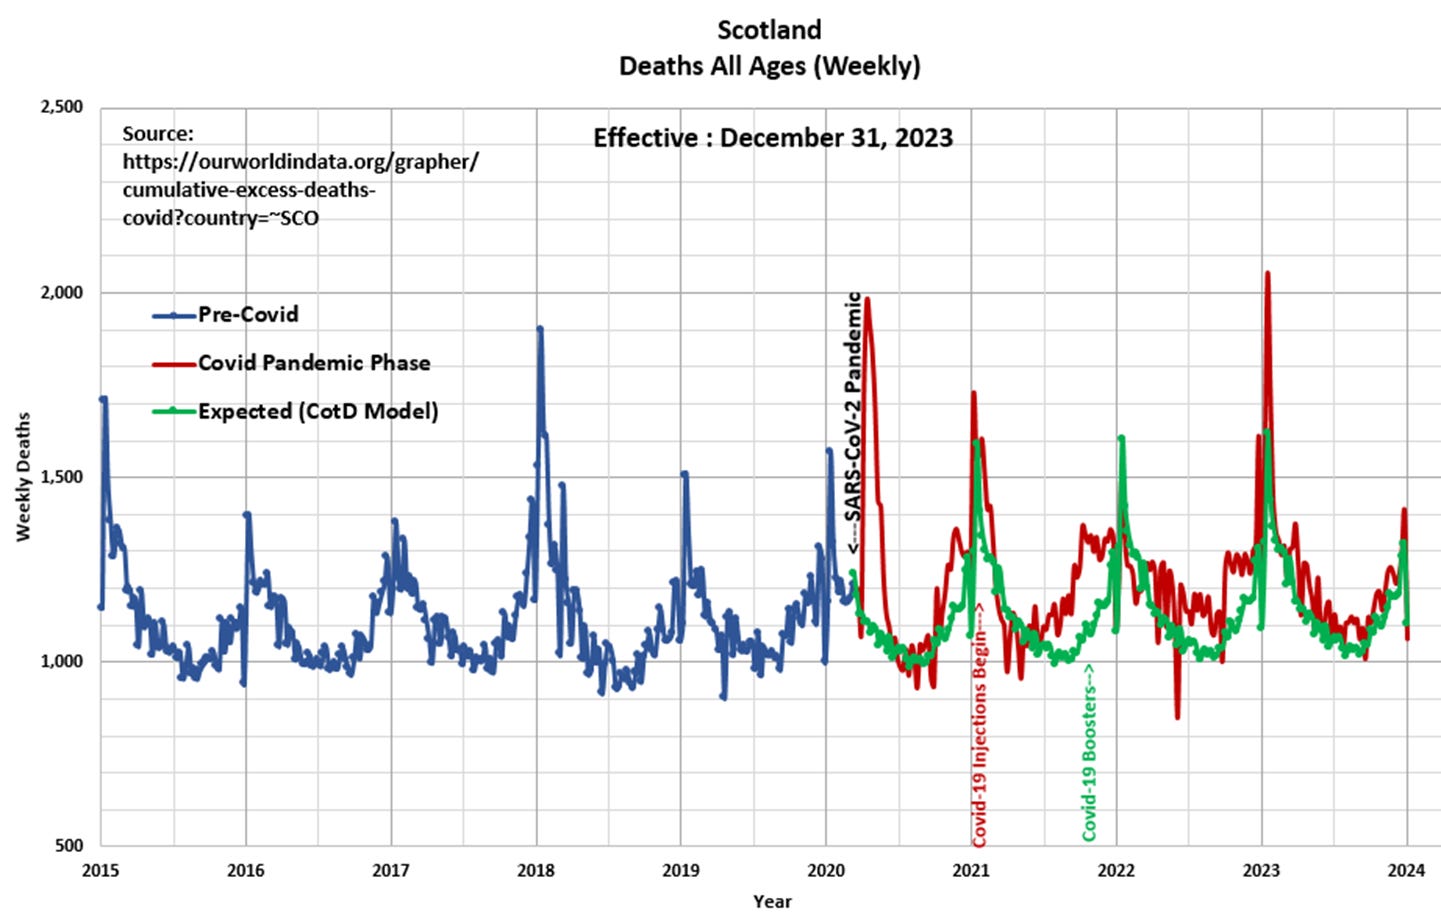
Panel 2 Observe the cyclical nature of deaths or all-cause mortality since 2015. The “Blue” line represents data prior to March 2020 and the “Red” line represents data since the SARS CoV-2 pandemic was initiated in March 2020. The “Green” line represents the “Expected” deaths (CotD Model) based on historical averages. The author has utilized the five year period January 2015 to December 2019 in order to calculate an average normalized curve for Weekly Deaths. The Expected (CotD Model) deaths incorporates an average 3.0 percent annual growth factor which appears to be a good match to the overall historical trend.

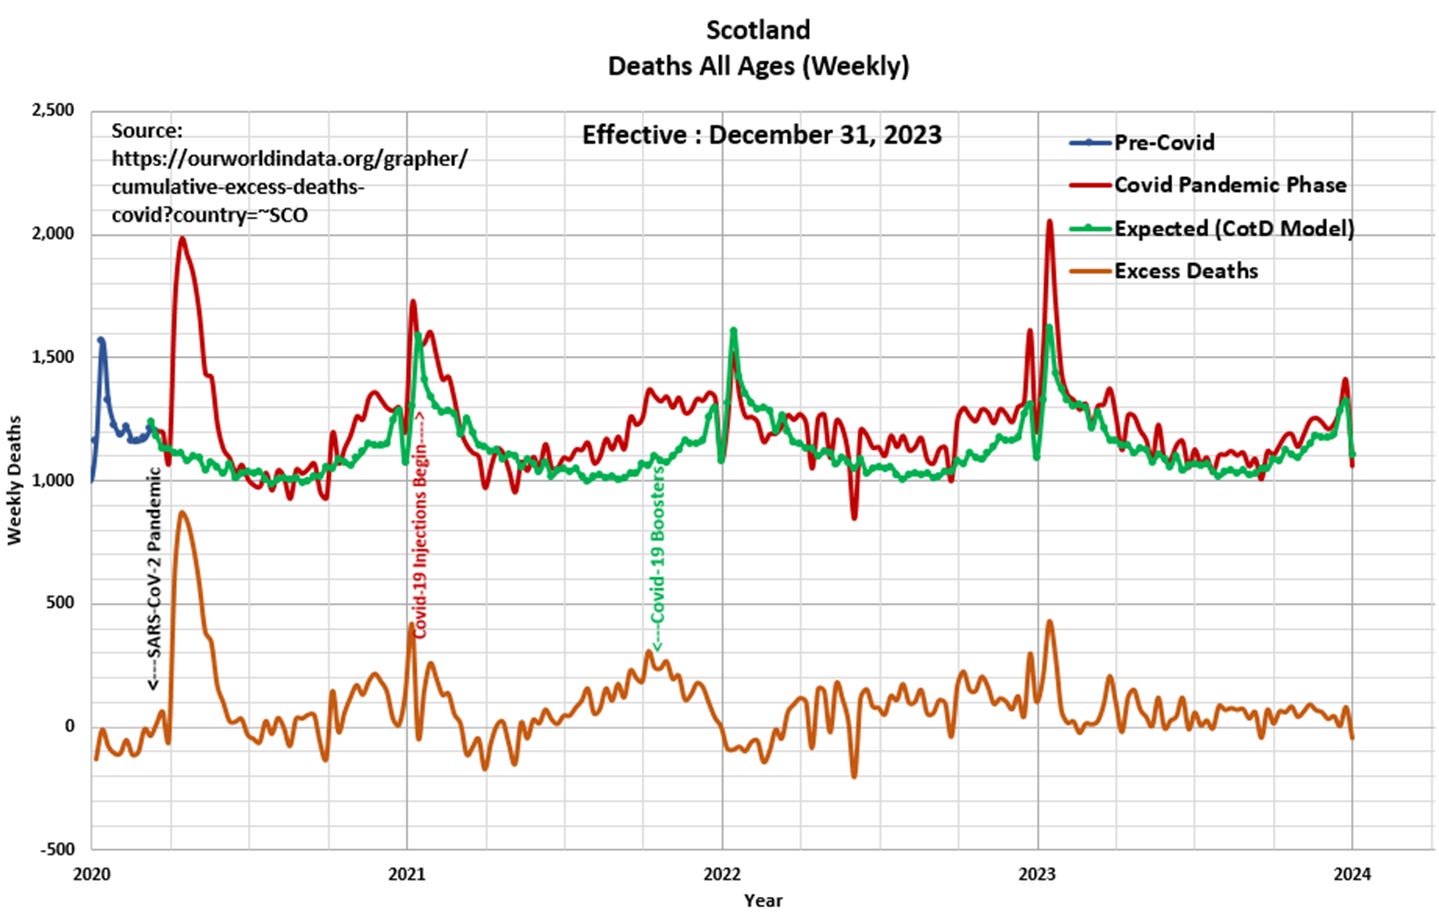
Panel 3 This presents the magnified portion (January 2020 to January 2024) of the graph in Panel 2. The “Orange” line represents “Excess Deaths” which is calculated by subtracting Expected Deaths from Official Deaths.

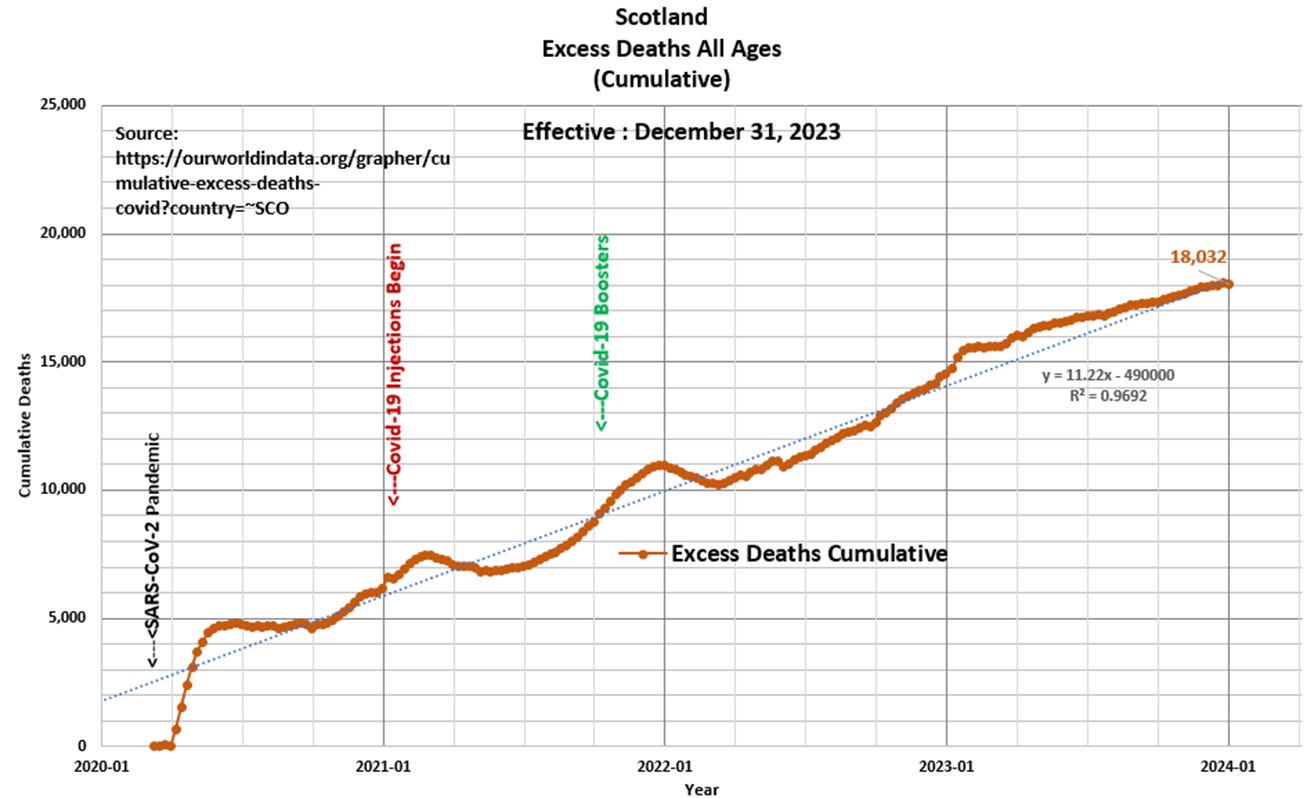
Panel 4 Based on the data and this author’s model 18,032 Excess Deaths have occurred since the start of the pandemic, of which 11,500 Excess Deaths (64 percent) have occurred since the start of Covid-19 injections in January 2021. As of February 2024, Scotland (and the United Kingdom) has revised the methodology in the calculation of Excess Deaths. Therefore, since the start of the pandemic, there were 20,202 Excess Deaths (utilizing the methodology prior to February 2024) versus 15,461 Excess Deaths based on the revised method as of February 2024. See the National Records of Scotland (NRC) link : https://www.nrscotland.gov.uk/statistics-and-data/statistics/statistics-by-theme/vital-events/general-publications/weekly-deaths-registered-in-scotland . Note that the CotD Model number of 18,032 Excess Deaths is essentially the midpoint of the two NRC methods.

“If they stand behind you protect them. If they stand beside you respect them. If they stand against you defeat them.” Unknown author


