by Eldric Vero
August 16, 2024
The following articles are relevant to this CotD:
1) MercoPress January 12, 2024 “Paraguayan experts call for action against Covid-19” (see link: https://en.mercopress.com/2024/01/12/paraguayan-experts-call-for-action-against-covid-19 ). As per the article: Guillermo Sequera believed “Now there is no syncytial virus, influenza, what we have is Covid-19 and dengue that is being added,” he said while pointing out that the protection of the vaccines lasts about six months with the last campaign dating back to around April last year.”
2) Global News February 15, 2022 “Tired of vaccines and mandates, COVID denialists start colony in Paraguay” (see link: https://globalnews.ca/news/8619343/covid-colony-el-paraiso-verde-paraguay-vaccines-mandates/ ). As per the article: First established in 2016, the colony was built built “with the dream of a better life and future outside of the ‘matrix’,” according to its website, but it’s now become a place where immigrants can escape all mandatory vaccinations — not just those for COVID-19. The colony, known as El Paraíso Verde, or the Green Paradise, advertises itself as a safe haven from “socialist trends or current economic and political situations worldwide,” as well as “5G, chemtrails, fluoridated water, mandatory vaccinations and healthcare mandates.”
The author of the CotD has combined analyses of Covid-19 and Excess Deaths (all causes) as these are related.
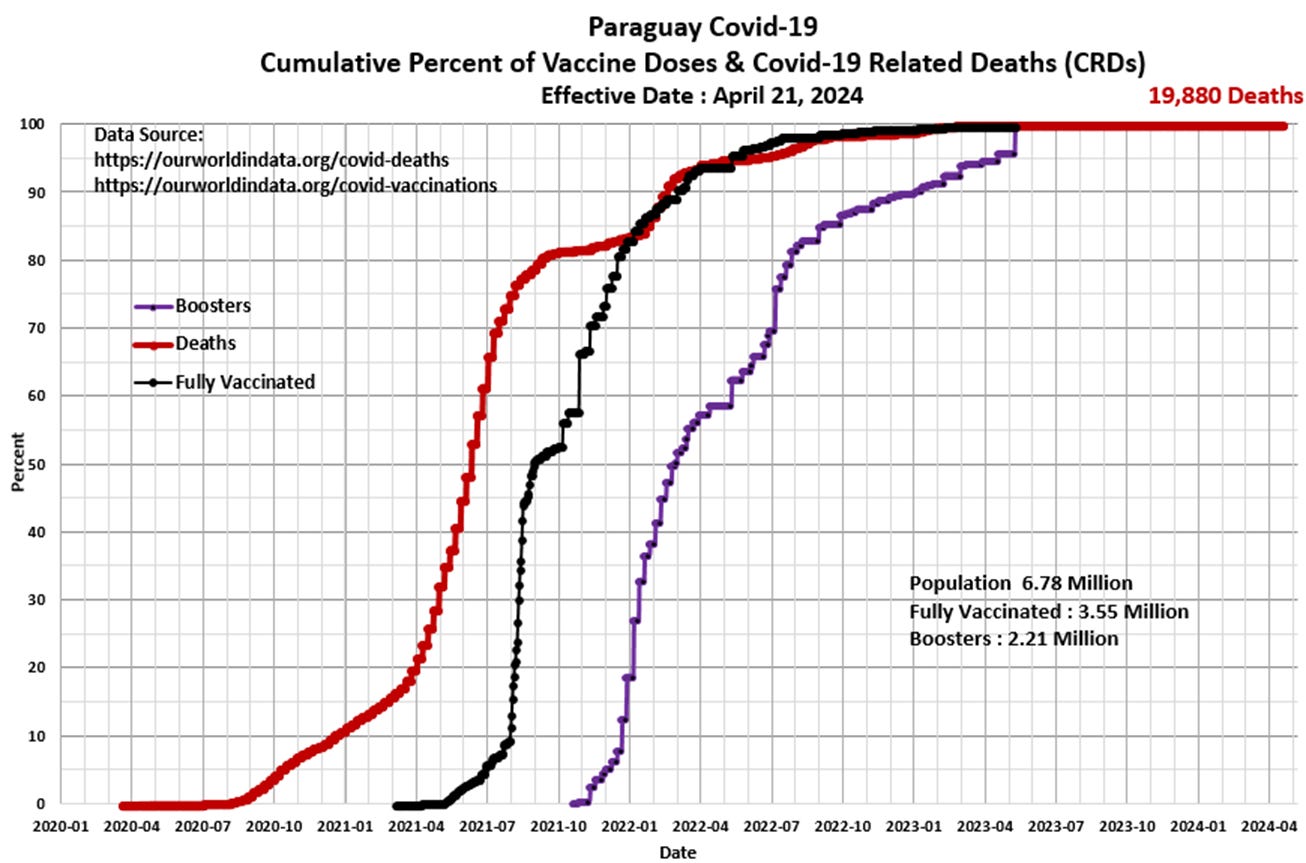
Panel 1 The first graph is a construct by the author as a standard CotD presentation which illustrates Covid-19 related deaths (CRDs) and vaccinations. Paraguay’s CRD rate was very low after the announcement of the SARS-CoV-2 pandemic in March 2020. However, heading into the spring/summer months of 2020/21, the CRD rate increased fairly substantially into Q2’2021 and then accelerated dramatically into Q3’2021. The vaccination program was initiated in March 2021 with very high injection uptake rates into Q4’2021, however, there was relatively minor impact on the CRD rate curve. The booster program was initiated in October 2021 with again, high injection rates into Q3’2022. The vaccine-to-death correlation appears to be self-evident starting in January 2022 based on these mirror-like curves. The CRD rate continued to climb into 2023, however, ultimately became zero as the vaccination uptake ended by mid-2023. Total CRDs to date represent 0.29 percent of the population.
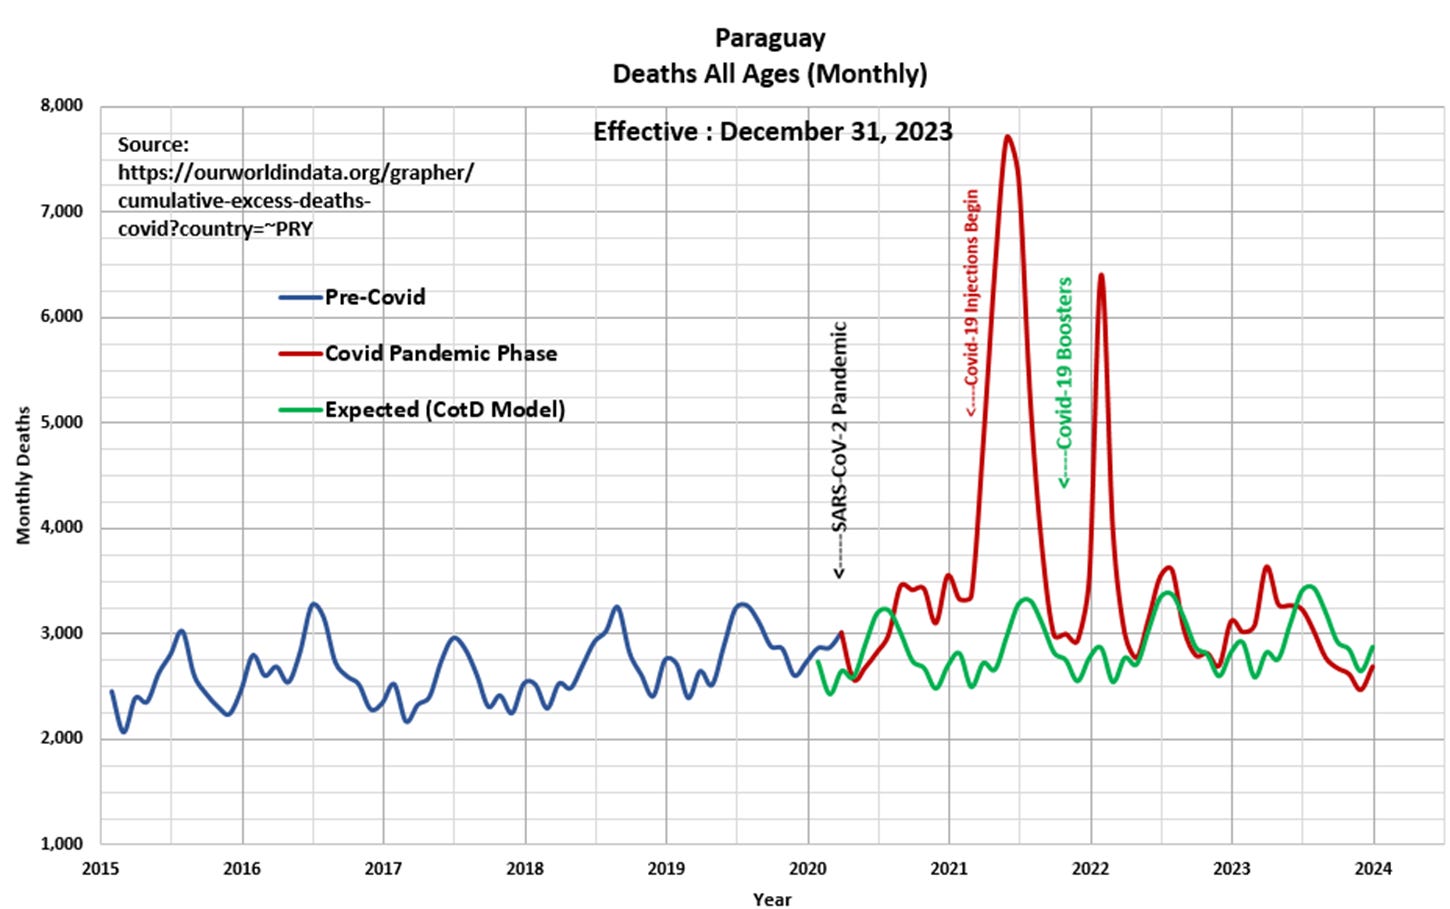
Panel 2 Observe the heterogeneous cyclical nature of deaths or all-cause mortality since 2015. The “Blue” line represents data prior to March 2020 and the “Red” line represents data since the SARS CoV-2 pandemic was initiated in March 2020. The “Green” line represents the “Expected” deaths (CotD Model) based on historical averages. The author has utilized the five year period January 2015 to December 2019 in order to calculate an average normalized curve for Monthly Deaths. The Expected (CotD Model) deaths incorporates an average 10.0 percent annual growth factor (the highest evaluated by the CotD author to date) which appears to be a good match to the overall historical trend.
Panel 3 This presents the magnified portion (January 2020 to January 2024) of the graph in Panel 2. The “Orange” line represents “Excess Deaths” which is calculated by subtracting Expected Deaths from Official Deaths. Note the extraordinary spike in Deaths shortly after the vaccine injections (i.e. 140 percent and 100 percent above the norm in May 2021 and January 2022, respectively).
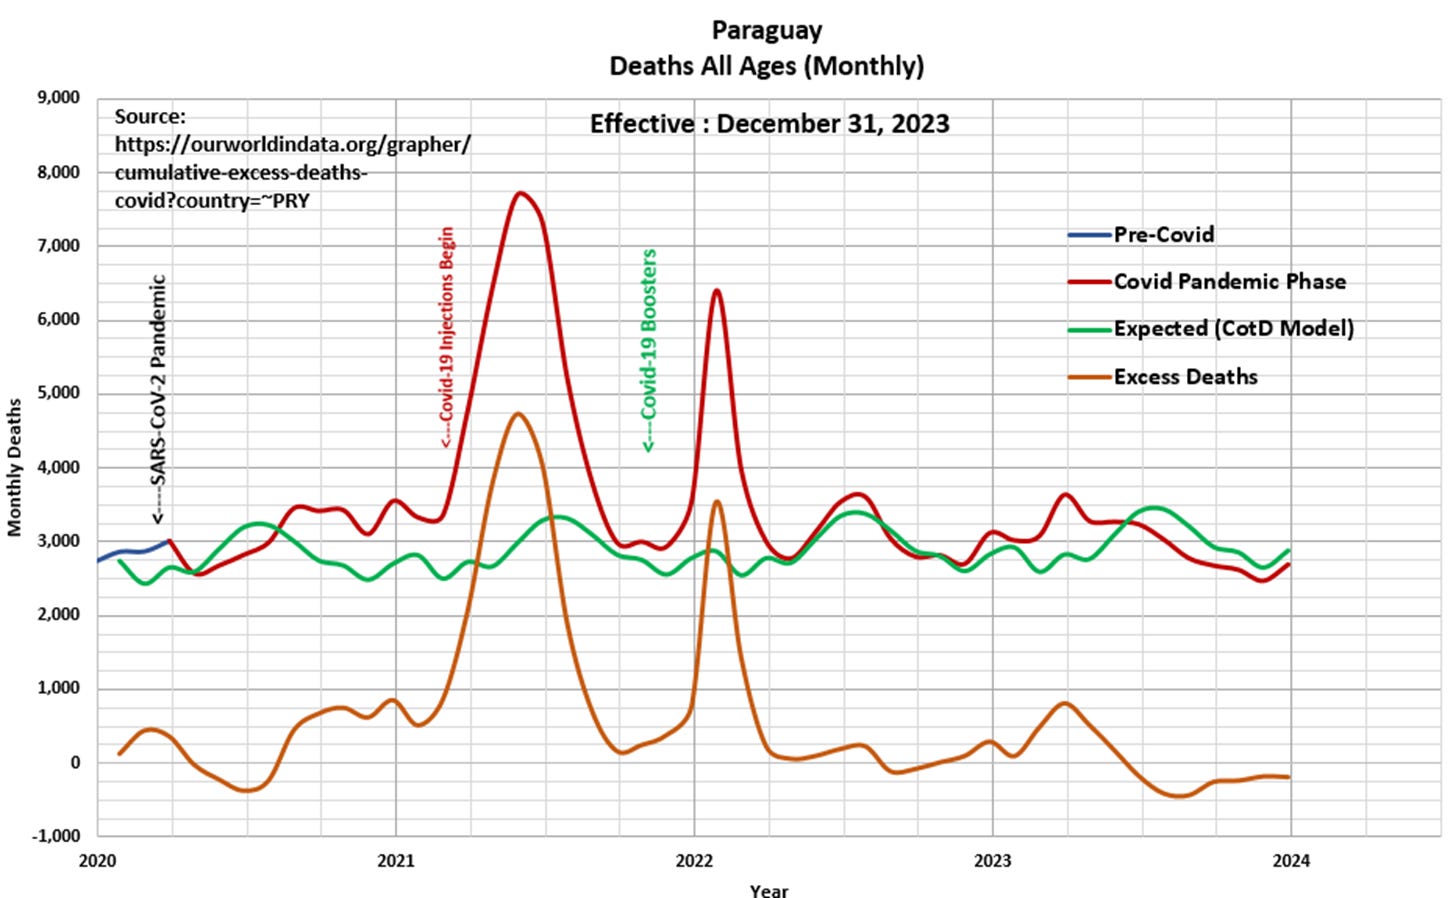
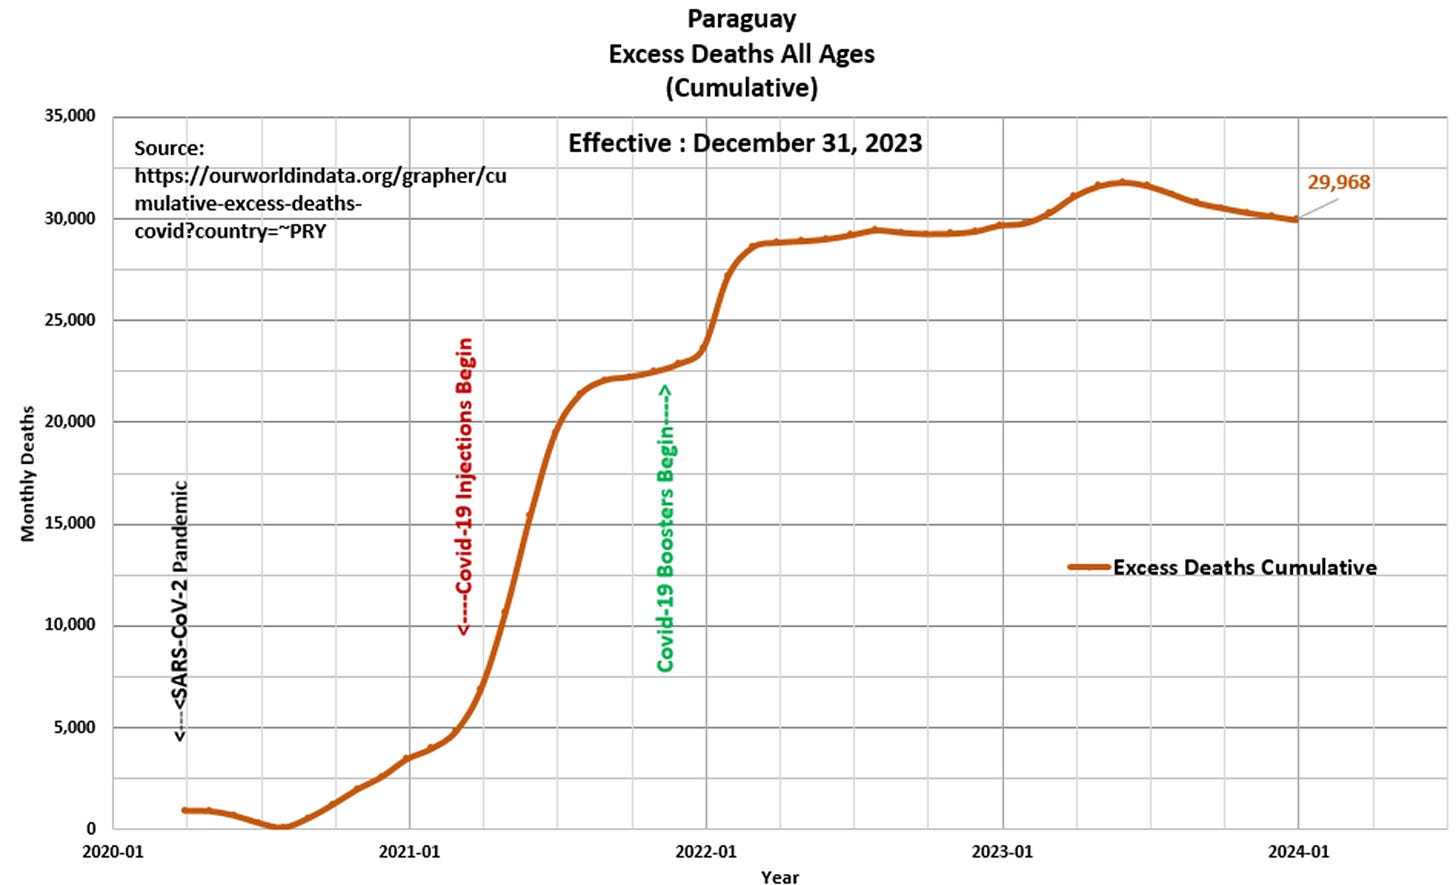
Panel 4 Based on the data and this author’s model 29,968 Excess Deaths have occurred since the start of the pandemic, of which 24,995 Excess Deaths (83 percent) have occurred since the start of Covid-19 injections in March 2021. This compares to 26,664 Excess Deaths since the start of the pandemic as per the ourworldindata.org website.
“The world must begin sharing again…we need more kindness” Takua Kawirembeyju, Guarani Shaman of Paraguay


