by Eldric Vero
August 20, 2024
The following articles are relevant to this CotD:
1) The Expose May 12, 2023 “It would be healthier and safer for humanity to sign an agreement with the Colombian drug cartel than with WHO, says MEP” (see link: https://expose-news.com/2023/05/12/it-would-be-healthier-and-safer-for/ ). As per the article: The third International Covid Summit was held at the European Parliament last week, on 3 May. The Members of the European Parliament (MEPs) who attended said it was a historic event. The Summit covered all aspects of the pandemic. It also covered the documentation of the increasing power grab by the World Health Organisation (WHO) and increased control by organised global entities. MEP Mislav Kolakušić (Croatia) said: “The World Health Organisation wants all countries to sign an agreement on handing over the authority to declare a pandemic, procure vaccines and drugs. It will be healthier and safer for humanity to sign an agreement with the Colombian drug cartel.
2) The Expose December 9, 2023 “Colombian Health Minister tells Senate covid vaccines are the greatest experiment carried out in human history” (see link: https://expose-news.com/2023/12/09/colombian-health-minister-tells-senate-covid-vaccines/ ). As per the article: “We are playing with the lives of Colombians, we cannot be a factor of experimentation…All Colombians who are vaccinated served for the largest experiment that has been carried out in the entire history of humanity” Colombian Health Minister Guillermo Alfonso Jaramillo said.
The author of the CotD has combined analyses of Covid-19 and Excess Deaths (all causes) as these are related.
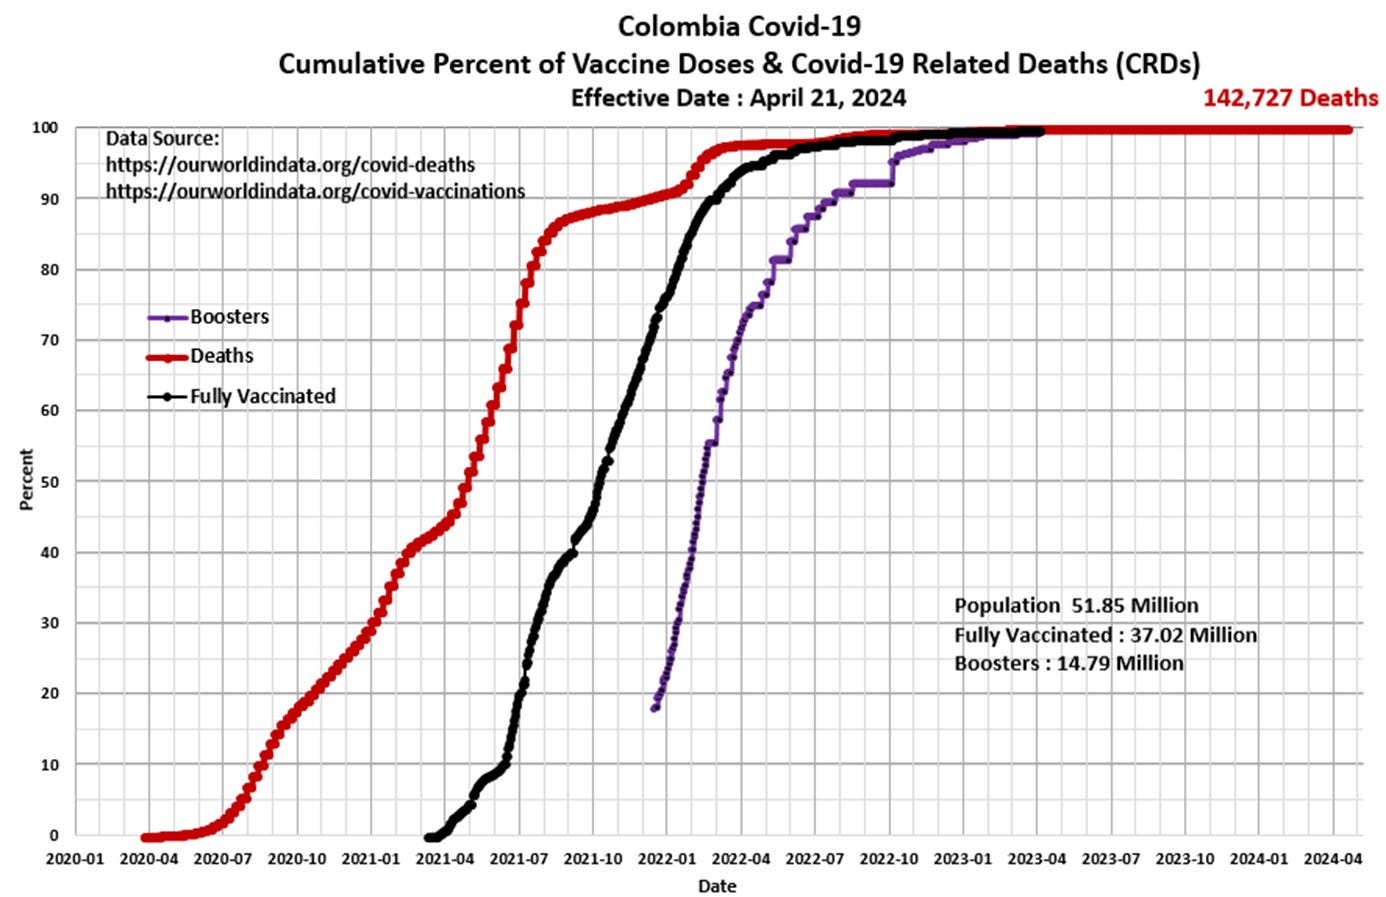
Panel 1 The first graph is a construct by the author as a standard CotD presentation which illustrates Covid-19 related deaths (CRDs) and vaccinations. The vaccination program began in March 2021 with little positive effect on reducing the CRD rate. The CRD rate essentially doubled over the four month period May to August 2021. The CRD rate subsided somewhat in Q4’2021, however, increased again in Q1’2022, shortly after the booster injections began. The CRD rate has subsided significantly and is essentially zero since Q2’2023.
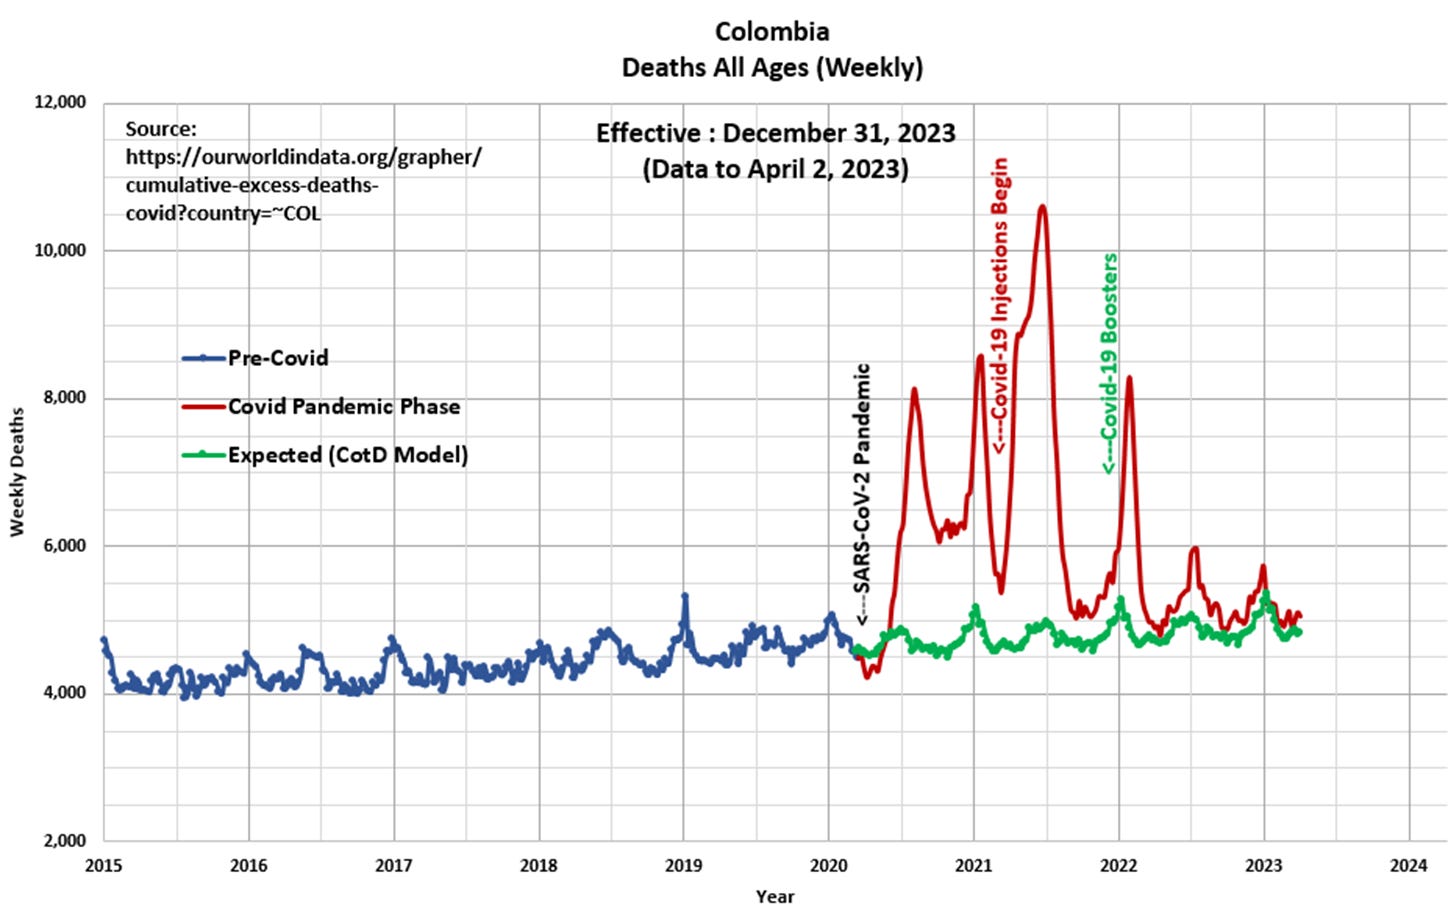
Panel 2 Observe the unique semi-annual cyclical nature of deaths or all-cause mortality since 2015. The “Blue” line represents data prior to March 2020 and the “Red” line represents data since the SARS CoV-2 pandemic was initiated in March 2020. The “Green” line represents the “Expected” deaths (CotD Model) based on historical averages. The author has utilized the five year period January 2015 to December 2019 in order to calculate an average normalized curve for Weekly Deaths. The Expected (CotD Model) deaths incorporates an average 10 percent growth factor (equal to the highest to date) which appears to be a good match to the overall trend.
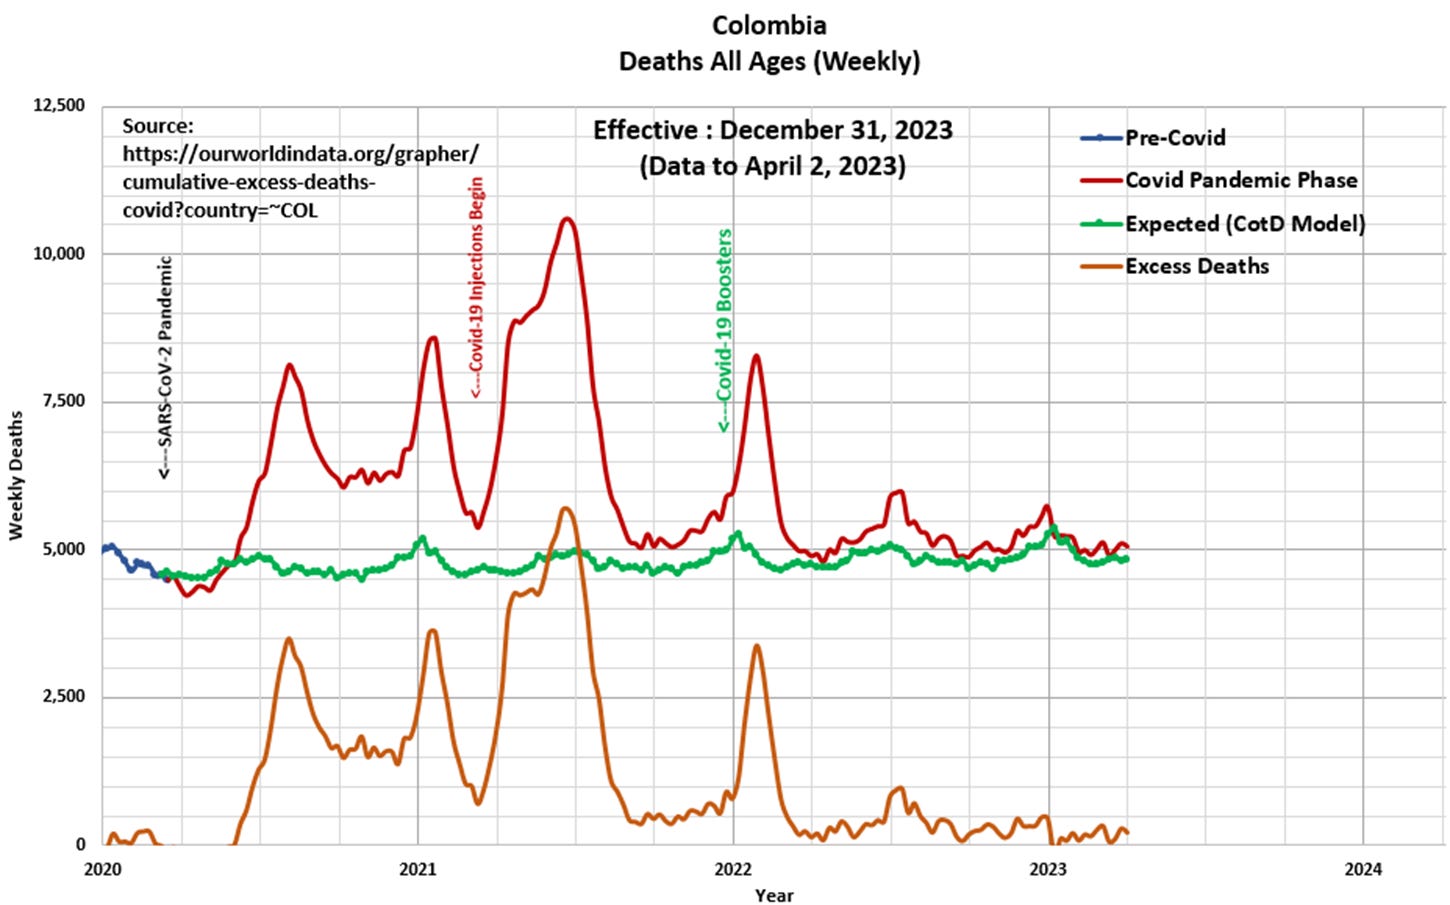
Panel 3 This presents the magnified portion (January 2020 to April 2023) of the graph in Panel 2. The “Orange” line represents “Excess Deaths” which is calculated by subtracting Expected Deaths from Official Deaths.
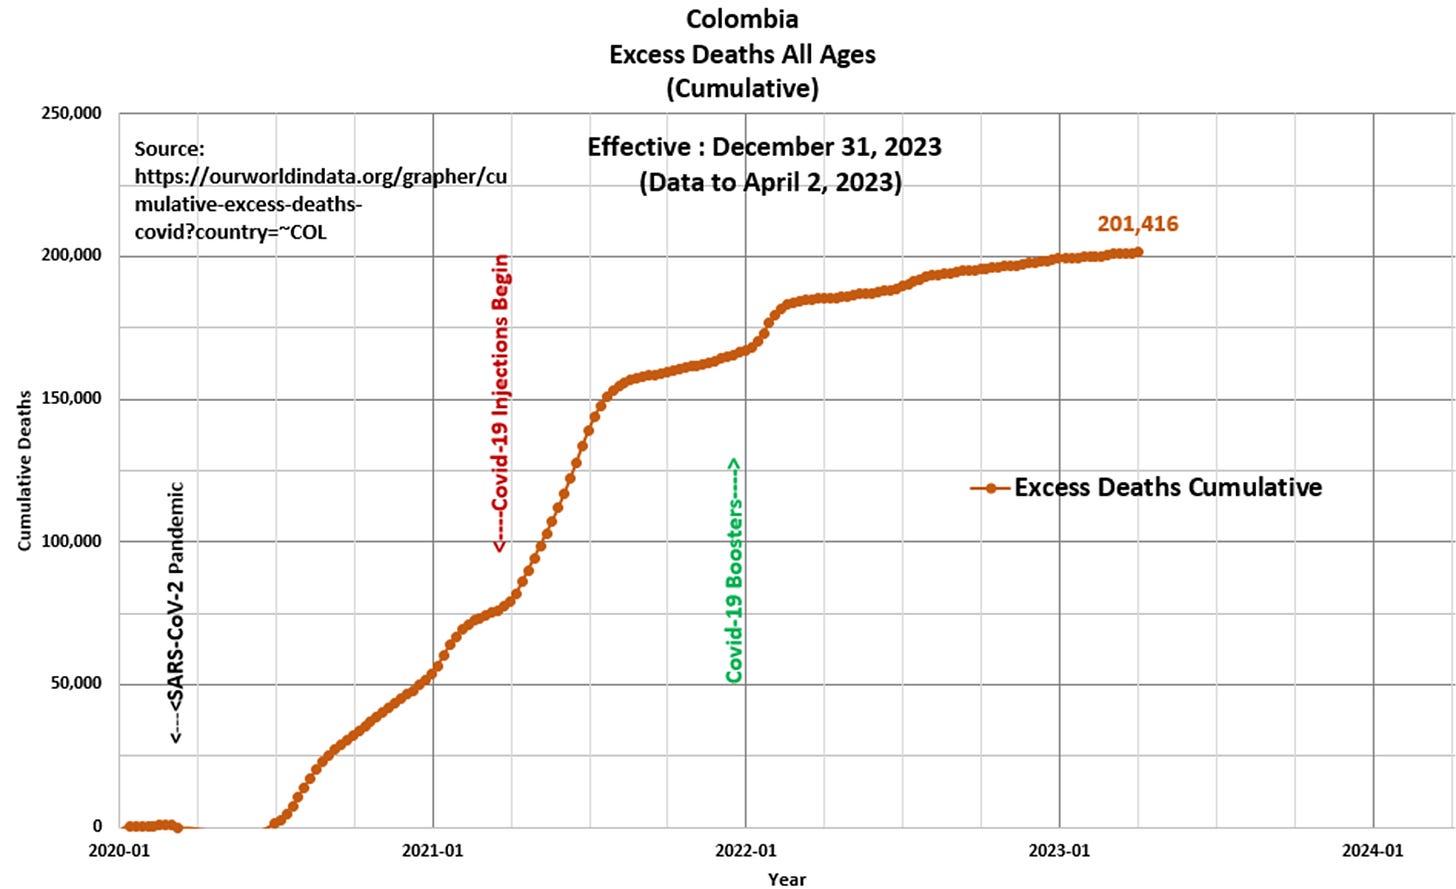
Panel 4 Based on the data and this author’s model 201,416 Excess Deaths have occurred since the start of the pandemic, of which 126,277 Excess Deaths (63 percent) have occurred since the start of Covid-19 injections in March 2021. This compares to 191,751 Excess Deaths since the start of the pandemic as per the ourworldindata.org website.
“The person who recognizes their major mistakes is on the road to wisdom.” Colombian Proverb


