by Elric Vero
October 7, 2024
The following articles are relevant to this CotD:
1) Super Sally’s Newsletter September 30, 2024 “ABS has released Australian Mortality Data from Jan – June 2024, with June Running 21% Above Baseline. 2024 Week 26 has the highest ever W26 deaths. Elderly Men fare worse than women” (see link: https://supersally.substack.com/p/abs-has-released-australian-mortality ). As per the article: ABS has released the provisional mortality data for January to June 2024, reporting more deaths than 2023 (+1.3%), but fewer than 2022 (-2.5%). Never forget that 2022 was 18.8% higher than the 2015-2019 baseline. Australian deaths remain well above levels which would have been expected based on pre-pandemic trending: Australia is yet to have any respite from the accumulating excess deaths.
2) The European Society of Medicine July 31, 2024 “The correlation between Australian Excess Deaths by state and Booster Vaccinations” by D. E. Allen (see link: https://esmed.org/MRA/mra/article/view/5485/99193548109 ). From the research article: The study explores the relationship by Australia State between COVID Booster Vaccinations and excess deaths. There is evidence of a very strong correlation in ordinary least squares regression analysis. Cross-validation tests support the strength of the regression relationship. The results suggest that it would be worthwhile to explore these associations in greater depth as it is an important public health issue.
In addition, please refer to the September 4, 2024 Chart of the Day (CotD) Australia Covid and Excess Deaths for related information (link : https://eldric.substack.com/p/chart-of-the-day-cotd-australia-covid-04e).
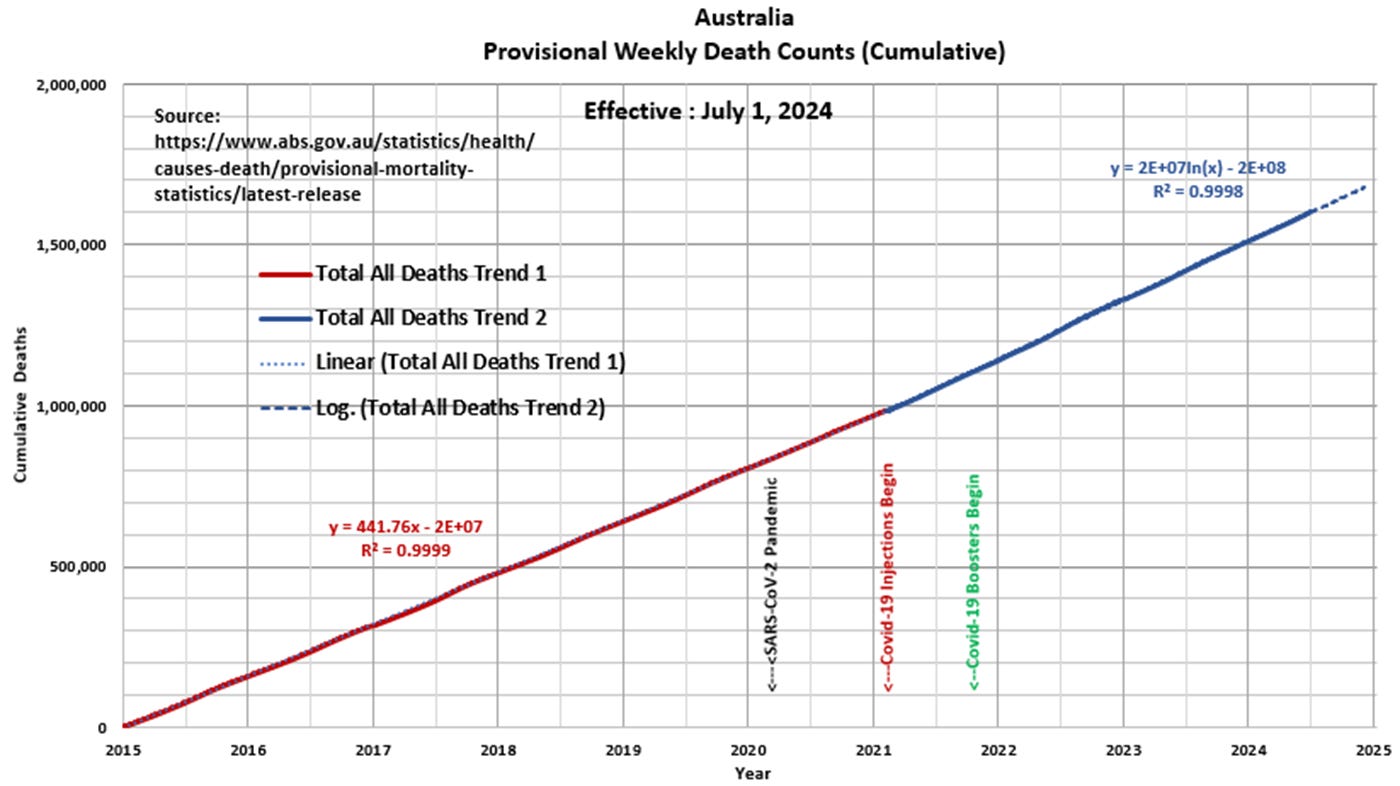
Panel 1 This is a graphical presentation of Australia’s “Provisional Weekly Death Counts” from 2015 utilizing the Australia Bureau of Statistics (ABS) database. The year 2015 is a baseline starting point for this analysis. The graph is a construct of the author as the ABS does not provide this type of presentation (as far as the author is aware). In terms of statistical and mathematical terms, this graph is not only unique, but near perfect in the sense that the “best fit” curves to the data matches 99.99 percent to the data as revealed by R2=0.9999. Also, the data trend started a logarithmic upward curvature in early 2021 which essentially reveals the death rate is accelerating over time. It appears something abnormal is occurring to Australian citizens since early 2021.
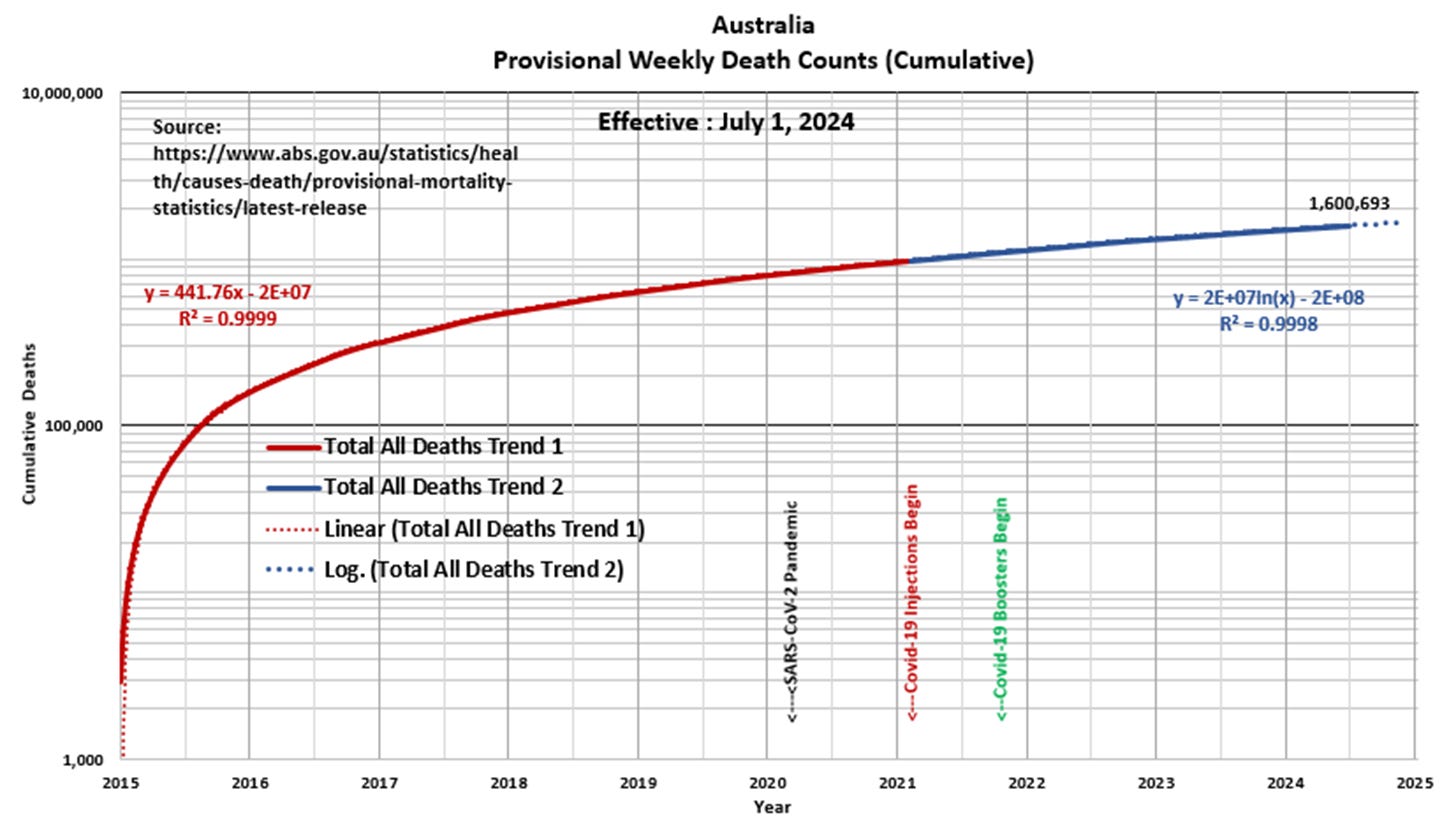
Panel 2 This is a semi-log plot of the same graph presented in Panel 1. Again, note the death rate transition from linear to logarithmic starting in early 2021. The semi-log plot is a fave of the CotD author.
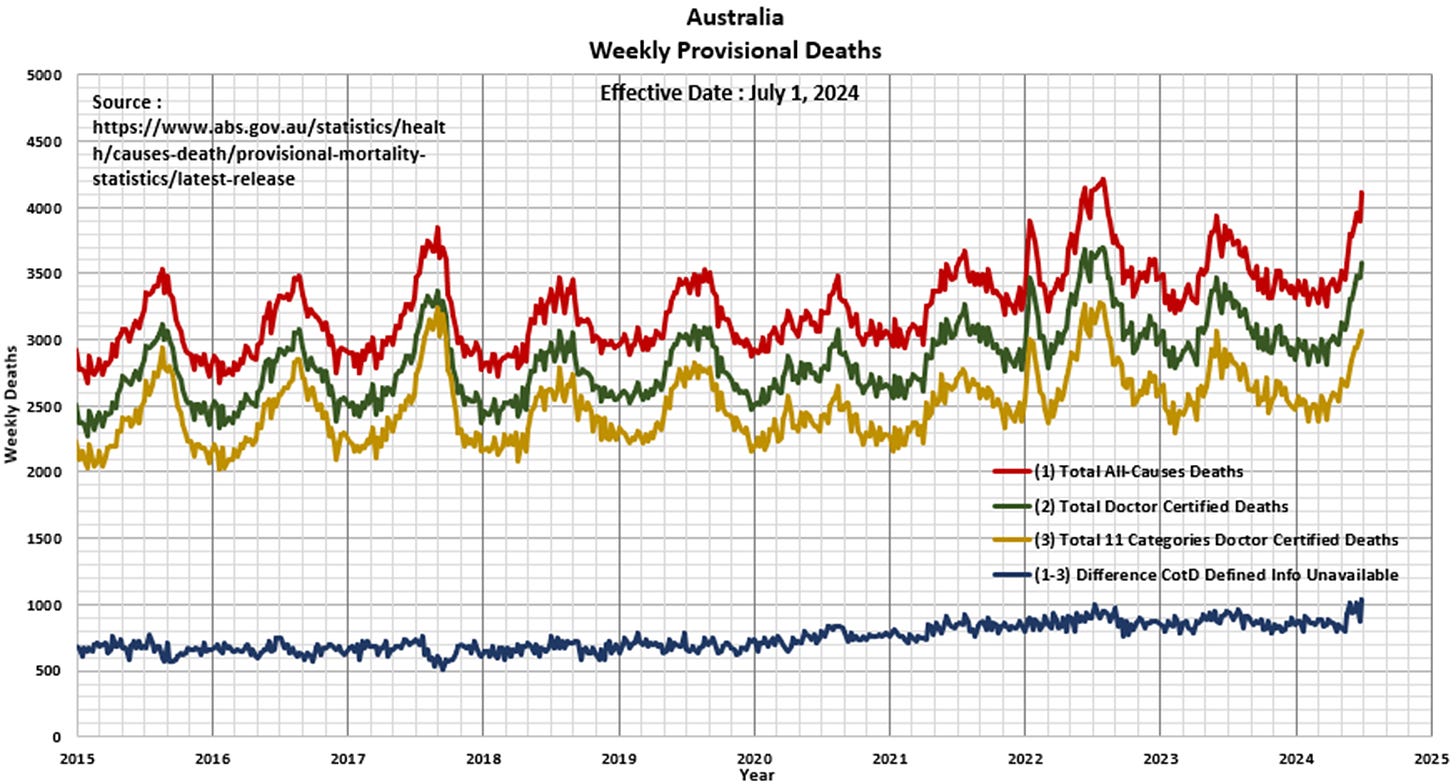
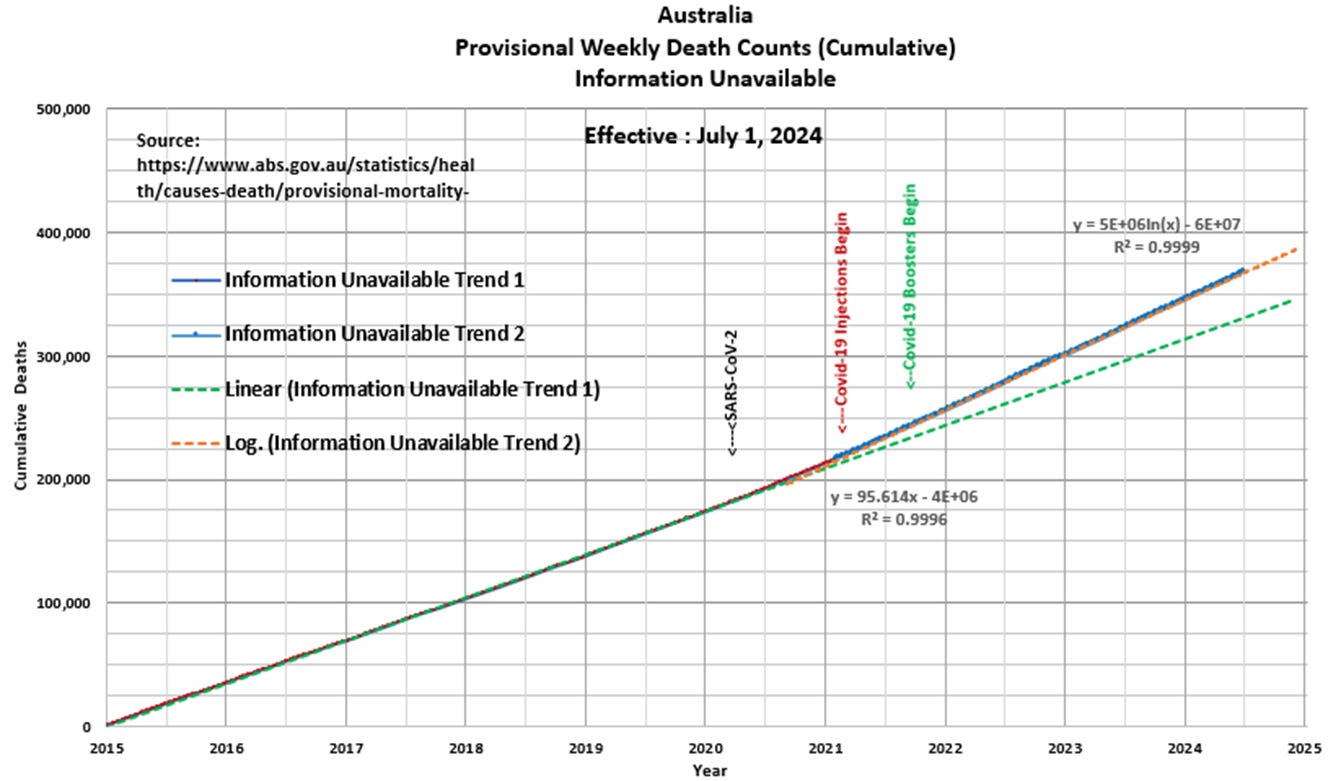
Panel 3 This graph is a construct of the CotD author as the ABS provides separate database sets for the period 2015 to 2023 and then the first half of 2024. Also the ABS includes a dataset for Doctor Certified Deaths and the main 11 Categories of Doctor Certified Deaths. It is likely the ABS does not include all causes of the death within the website resulting differences displayed in the datasets. In order to view the differences, the CotD author has created a category defined as “Information Unavailable” which essentially captures All Other deaths.
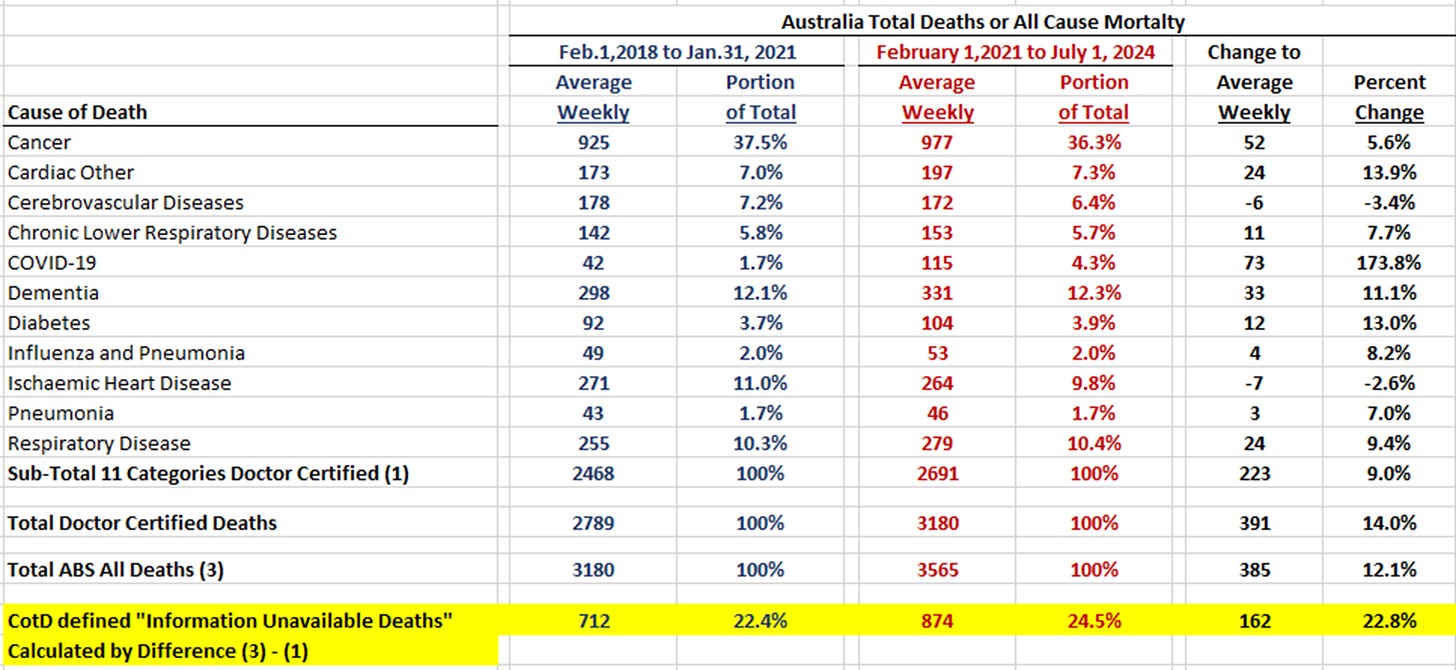
Panel 4 The following table presents the Cause of Death categories as per the ABS : https://www.abs.gov.au/statistics/health/causes-death/provisional-mortality-statistics/latest-release. Utilizing data within the ABS website, a summary table was created depicting two recent periods for comparison purposes (February 1, 2018 to January 31, 2021 and February 1, 2021 to July 1, 2024). Note that the CotD defined Information Unavailable Deaths category comprises close to 25 percent of All Deaths and is growing with time.
Panel 5 Here is the CotD defined Information Unavailable dataset since 2015. Again, note the transition from a linear trend to a logarithmic curve trend.
As per the Australian Government Department of Health and Aged Care under Side Effects from Immunisation…”Immunisations are safe and effective, although all medication can have unwanted side effects…Most reactions are mild and go away quickly. In general, most children who have had a reaction to a vaccination can be safely re-vaccinated.” Do you think the data supports these claims by the Australian Government?
“The truth hurts, but silence kills” Mark Twain
Opus the Penguin and Bill the Cat (created by Berkeley Breathed)


