by Eldric Vero
November 10, 2024
The following articles are relevant to this CotD:
1) SWI swissinfo.ch News November 3, 2024 “Swiss Covid expert calls for caution on vaccination recommendations” (see link: Swiss Covid expert calls for caution on vaccination recommendations – SWI swissinfo.ch). As per the article: Christoph Berger, former president of the Federal Commission for Vaccination Questions, would be “even more cautious today” when it comes to vaccination recommendations for Covid-19. In the interview, Berger also calls for people with complications following vaccination to be taken seriously. Such reports should be investigated and actual vaccination damage recognised.
2) The Expose News April 3, 2024 “Switzerland Legal team files updated criminal case against Swissmedic” (see link: https://expose-news.com/2024/04/03/legal-team-files-criminal-case-against-swissmedic/ ). As per the article: “By 1 March 2022, at least 128 peer-reviewed publications on heart problems, 216 peer-reviewed publications on life-threatening coagulation disorders (thromboses, etc.) and six peer-reviewed publications on possible deaths as a result of covid vaccinations had been published,” the complaint states. The complaint then details how “covid-19” is not and has never been a “life-threatening or debilitating” disease that threatens the public at large. “In view of the above, Swissmedic authorised a highly experimental and dangerous medicinal product to prevent a disease that poses no greater threat to the population as a whole than influenza does,” Kruse and his team state.
The author of the CotD has combined analyses of Covid-19 and Excess Deaths (all causes) as these are related.
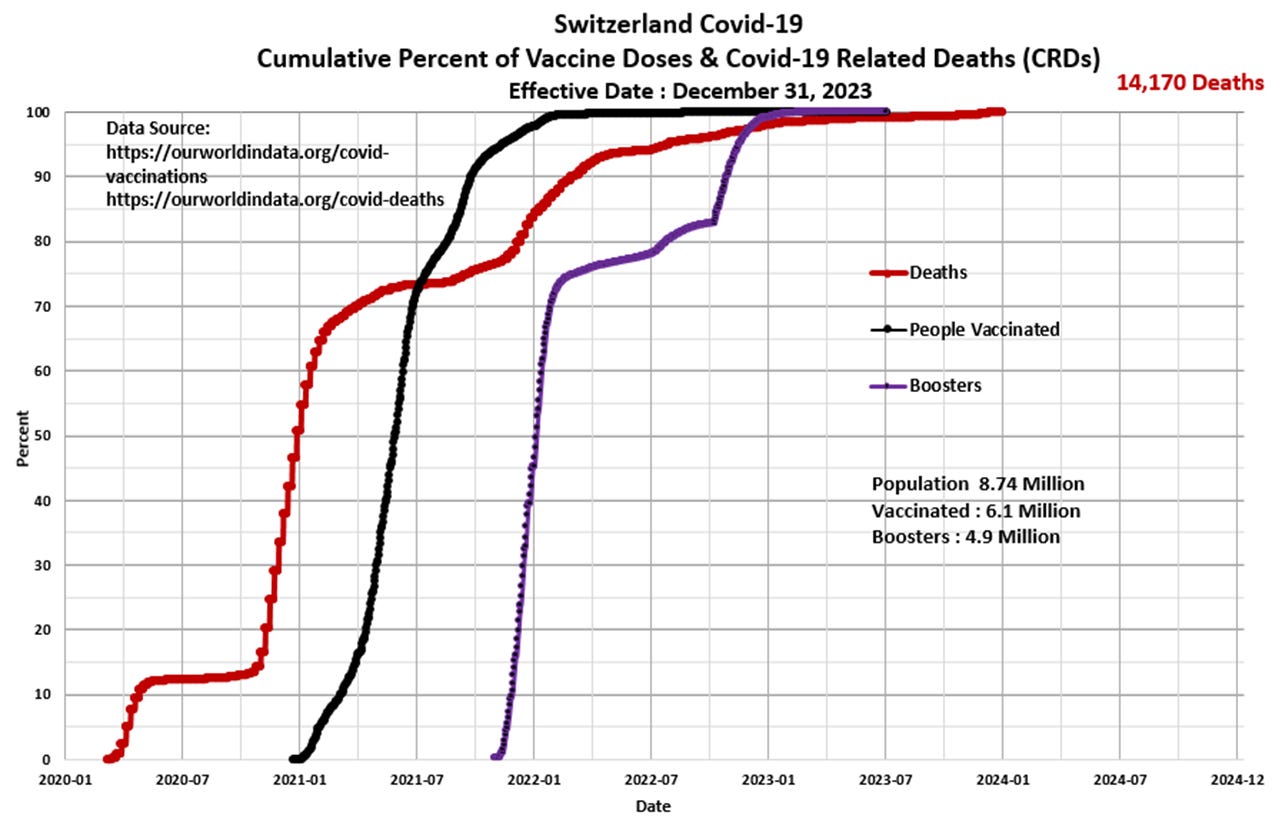
Panel 1 The first graph is a construct by the author as a standard CotD presentation which illustrates Covid-19 related deaths (CRDs) and vaccinations. Switzerland’s Covid-19 Related Death (CRD) rate was noticeable immediately upon announcement of the SARS-CoV-2 pandemic in March 2020 and then “flattened” during the summer months. The CRD rate took-off in Q4’ 2020 and continued into Q2’2021. The vaccination program was rolled-out in late December 2020 with high injection rates into Q3’2021. The vaccine appeared to be effective as the CRD rate “flattened” somewhat in mid-2021 after about 40 percent of the population had been injected. The booster program was initiated in Q4’2021 with extremely high injection rates that continued into Q1’2022. The booster-to-death correlation appears to be self-evident starting in Q4’2021 as the CRD rate increased once again. The CRD rate has declined significantly since Q2’2023 as vaccination uptake has waned and is essentially zero. Total CRDs to date represents 0.16 percent of the population.

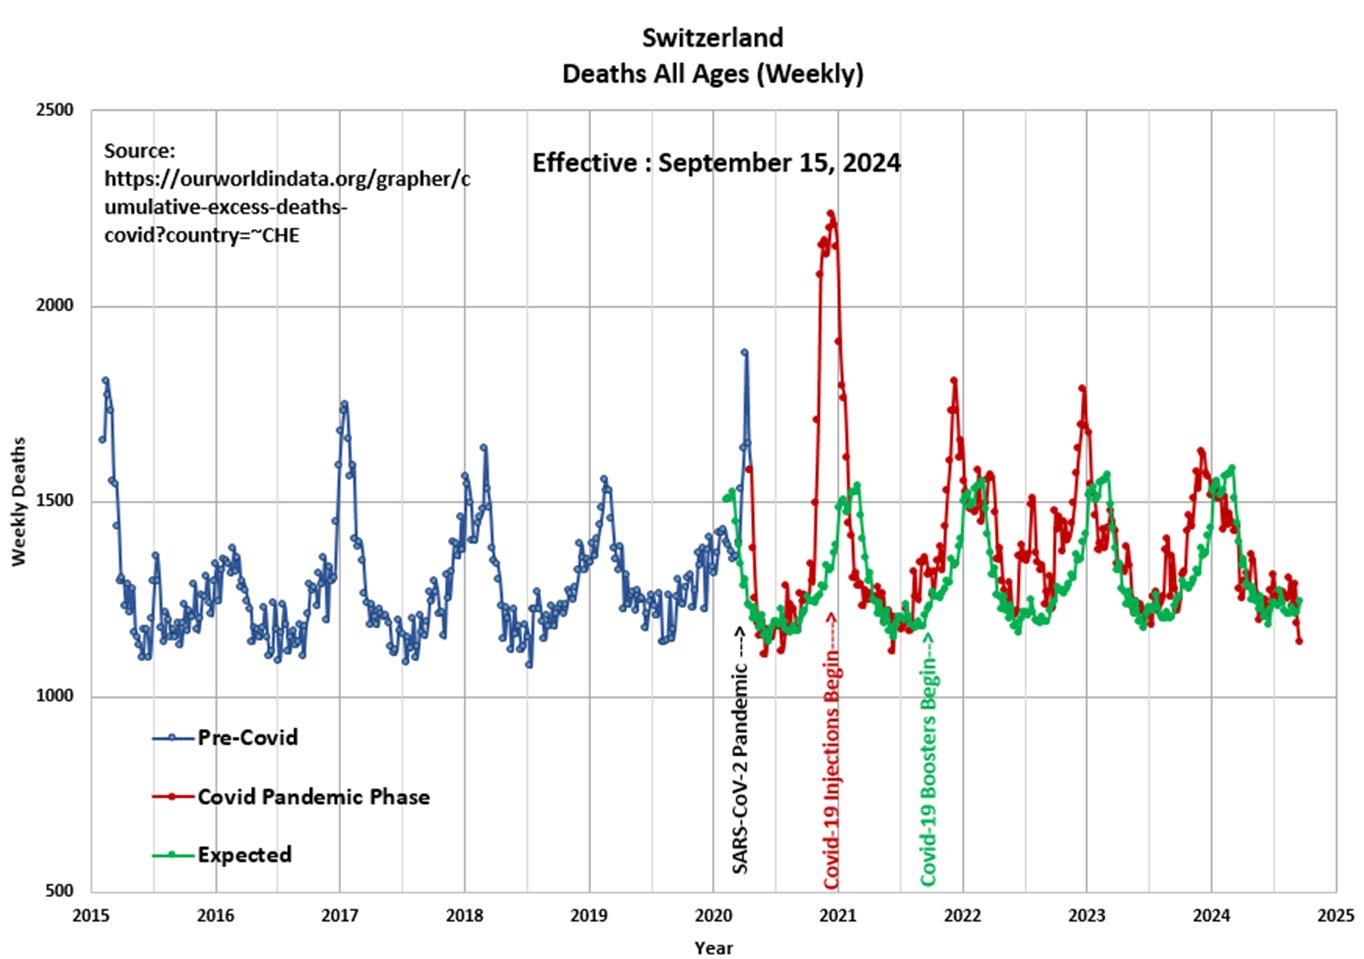
Panel 2 Observe the cyclical nature of deaths or all-cause mortality since 2015. The “Blue” line represents data prior to March 2020 and the “Red” line represents data since the SARS CoV-2 pandemic was initiated in March 2020. The “Green” line represents the “Expected” deaths (CotD Model) based on historical averages. The author has utilized the five year period January 2015 to December 2019 in order to calculate an average normalized curve for Weekly Deaths. The Expected (CotD Model) deaths incorporates an average 2.5 percent growth factor which appears to be a good match to the overall historical trend.

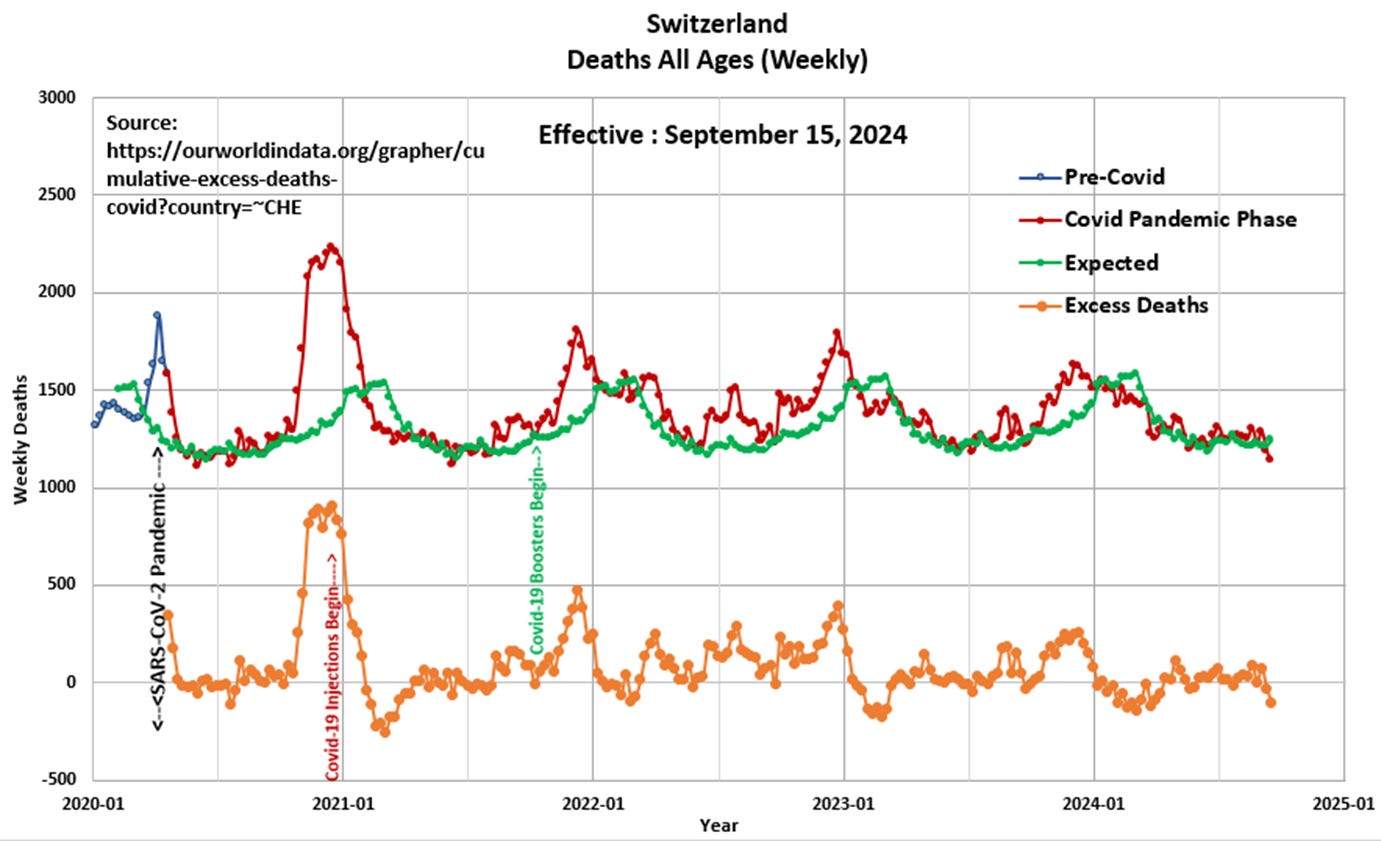
Panel 3 This presents the magnified portion (January 2020 to September 2024) of the graph in Panel 2. The “Orange” line represents “Excess Deaths” which is calculated by subtracting Expected Deaths from Official Deaths.

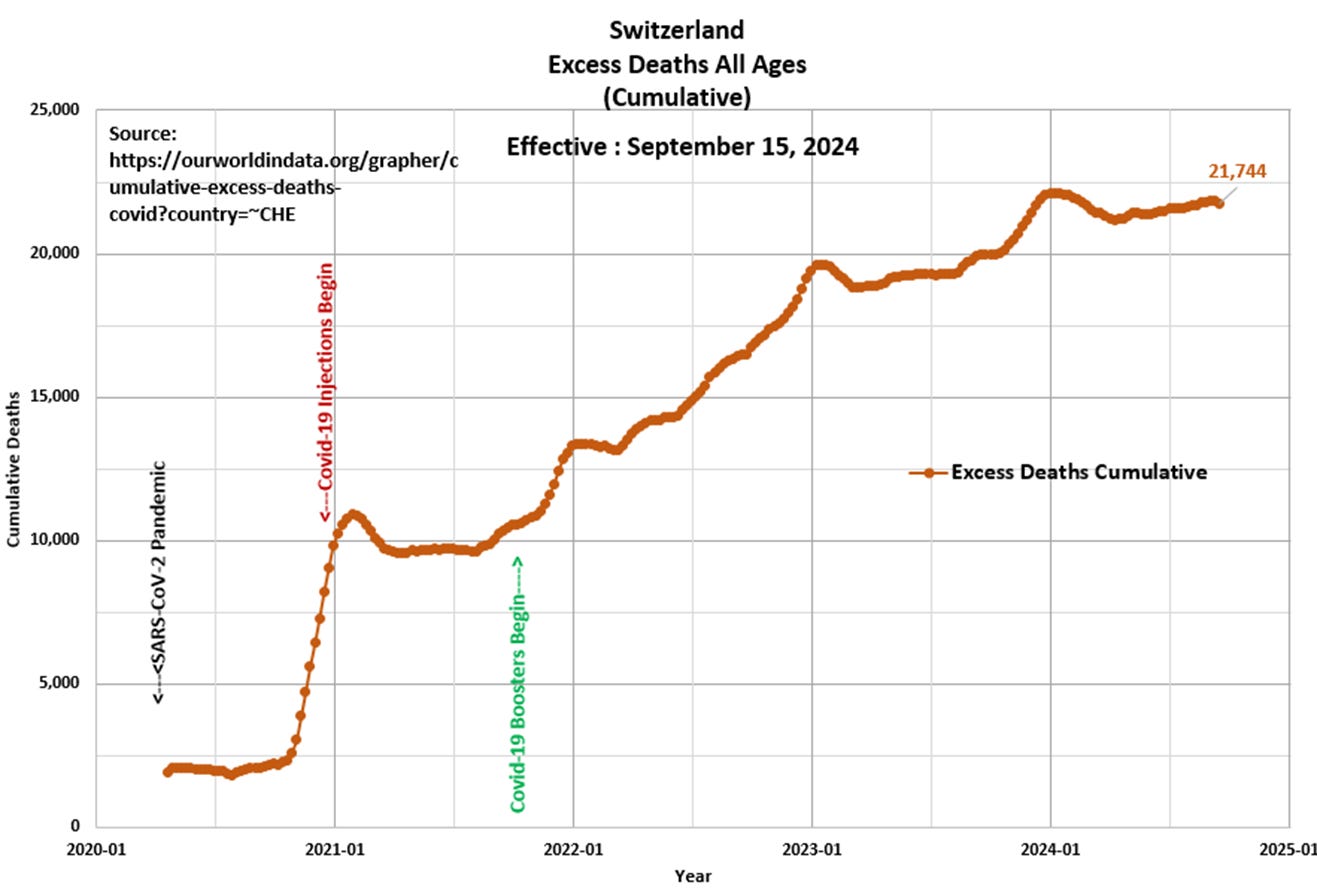
Panel 4 Based on the data and this author’s model 21,744 Excess Deaths have occurred since the start of the pandemic, of which 12,700 Excess Deaths (58 percent) have occurred since the start of Covid-19 injections in January 2021. This compares to 21,270 Excess Deaths since the start of the pandemic as per the ourworldindata.org website.

“The world is a dangerous place to live…not because of the people who are evil, but because of the people who don’t do anything about it” Albert Einstein

